MPRU, revenue and how it relates to revenue and customer base dynamics
In this article, let's look at the MRPU, let's see what are the features of its calculation and what it can give us.
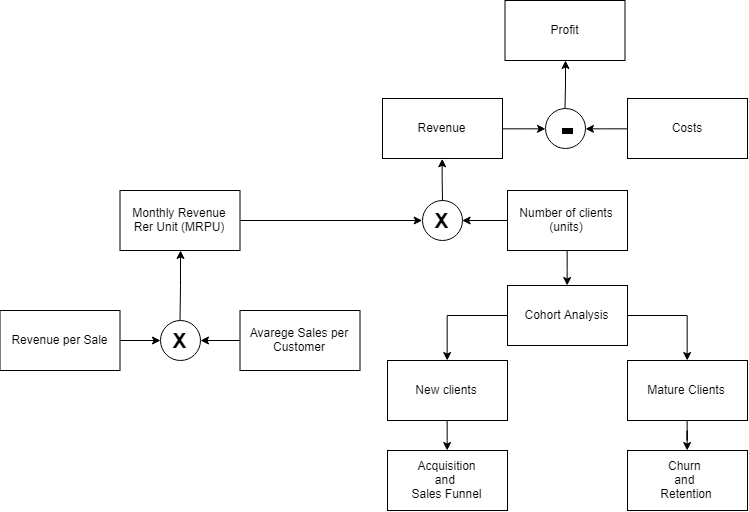
MRPU - monthly revenue per unit, monthly revenue per unit. This is a broad concept that includes both the average check and the average revenue per user / client / sale. The flexibility of the word unit allows you to give the definition you need.
Why do we need it? The whole purpose of product analysis is to isolate the causes and identify factors that affect financial performance. The dynamics of the client base ( see the article here ) mainly determine the factors related to your work on attraction and retention. MRPU affects your prices, set of services and completeness of the services provided. Although your success in attracting depends on prices and a set of services, the MRPU in our revenue equation is directly responsible for the money itself.
We can vary the concept of MRPU depending on your context. The ideology of this metric is:
- Period - Monthly
- Indicator - Revenue
- Per - Per
- Unit - Unit
This formula potentially generates a whole class of metrics for you: WRPC (weekly revenue per customer), DRPP (daily revenue per purchase), DPPC (daily profit per customer, why not, although this metric falls a bit out of the logic of my story). I think the idea is clear. For this reason, for me, the average check and the average revenue per customer are from about the same area, although, of course, they show different things.
In the context of our narration, we decompose the client base into clients, not checks, so it’s logical that we’ll talk about average revenue per client, and then we can break this down into an average number of transactions per month * into an average check.
What does the MRPU dynamics show us?
Changes in MRPU depend on changes in the attendance of your resources, the number of acquisitions.
- For the purpose of MRPU, this is exactly the deal. On the other hand, the number of transactions depends on the number of times when a client could spend money on you, i.e. This is a derivative of the number of visits and the regularity of needs for your product. I want to note that not every product and product can affect the number of visits. If the microtransactions in the application are affected by the player’s involvement, then a visit to the traumatologist is weakly related to the patient’s involvement in the interaction with the clinic (except for interaction with the brand).
- The change depends on the amount of the average check, the amount that the user leaves for one transaction. The amount of the average check is determined by the nature of the services you offer and the emphasis in your marketing.
In the article on cohorts, we looked at how we can divide the client base into groups of new, old, reactive, and departed. In order for the MRPU analysis to be meaningful, it is worth analyzing it for these groups, since They are radically different in their behavior:
- New and reactivated customers are mainly your onboarding, how much do you manage to sell to a client at the time of starting / resuming a relationship. Often they may have small average checks. Due to the growth in attracting clients, this can negatively affect the average check and lead to an incorrect impression that customers are buying worse. Well, and vice versa, the total death of an attraction may look like an increase in MPRU.
- Existing customers - their MRPU is usually well established, relatively high. The dynamics of indicators in this group shows your success and not success in relationships with regular customers.
- Departing clients (those who left in the reporting period) - their consideration rather shows losses on average check. But if you don’t single out separately, then often the customers that you’ve already lost will affect your picture of dynamics. they will have a balance of regular payments in the period under review. This will make the analysis less clear and lower the MRPU / average bill.
What conclusions can we make from the change in the derived indicators of MRPU:
- Changing the number of checks per customer is a bell of problems in your onboarding. Perhaps you have problems with performance, convenience, clarity of materials, or you may have launched marketing activities on a not very successful audience.
- The amount of the average check for a client changes - most often it is a pointer to the dynamics in the structure of your audiences and user segments. For example, your advertising company promotes products with an average price, their share in the sales structure grows, and the share of expensive ones falls, then you will drop the average bill, although this is not a problem in this case. Another case is that a change can be a signal that expensive services fall out, cheap (and vise versa) grow, while maintaining the same segment structure. This is a stronger signal about the problems in your services and products, expensive positions are probably not in the market at a price or they have quality problems. All this should be considered by decomposing the average check into a structure by groups of services, and looking at the average check in the context of various segments.
This is the 6th article in a series of articles on product analysis: