Article life cycle on Habré: we write habraparser
Hi Habr!
Many regular readers and authors of the site probably thought about the life cycle of articles published here. Although it is intuitively more or less clear (for example, it is obvious that the article on the first page has the maximum number of views), but how much exactly?
To collect statistics, use Python, Pandas, Matplotlib and Raspberry Pi.
Those who are interested in what came out of this, please under the cat.
To begin with we will be defined with metrics - that we want to learn. Everything is simple, each article has 4 main parameters displayed on the page - this is the number of views, likes, bookmarks and comments. We will analyze them.
Those who want to see the results immediately, can go to the third part, but for now it will be about programming.
The general plan: parse the necessary data from the web page, save it with CSV, and see what we did for a period of several days. To get started, let's download the text of the article (exception handling is omitted for clarity):
Now, from the data_str line (of course, in HTML) you need to extract the data. Open the source code in the browser (non-basic elements are removed):
It is easy to see that the text we need is inside the block '<ul class = "post-stats post-stats_post js-user_>', and the necessary elements are in the blocks with the names voting-wjt__counter, bookmark__counter, post-stats__views-count and post- stats__comments-count. By name, everything is quite obvious.
Inherit the class str and add to it a method for extracting a substring between two tags:
It was possible to do without inheritance, but this will allow you to write a more concise code. With it, all data extraction fits into 4 lines:
But that is not all. As you can see, the number of comments or views can be stored as a string of type “12.1k”, which is not directly translated to int.
Add a function to convert such a string into a number:
It remains only to add the timestamp, and you can save the data in csv:
Since we are interested in analyzing several articles, we will add the ability to specify a link via the command line. We will also form the name of the log file by the article ID:
And the very last step. We print the code in the function, loop through the data, and write the results to the log.
As you can see, the data update is done every 5 minutes in order not to create load on the server. I saved the program file as habr_parse.py, when it starts it will save data until the program is closed.
Further, it is desirable to save the data, at least for several days. Since keep the computer turned on for several days reluctantly, take the Raspberry Pi - its power for such a task is enough without any problems, and unlike in the PC, the Raspberry Pi does not make noise and almost does not consume electricity. Go through SSH and run our script:
The nohup command leaves the script to work in the background after closing the console.
As a bonus, you can run an http server in the background by entering the command „nuhup python -m SimpleHTTPServer 8000 &“. This will allow you to view the results directly in the browser at any time, opening the link of the form http://192.168.1.101:8000 (the address may of course be different).
Now you can leave the Raspberry Pi enabled, and return to the project in a few days.
If everything was done correctly, then the output should be something like this log:
Let's see how it can be processed. First, load the csv into the pandas dataframe:
Add functions for converting and averaging, and extract the necessary data:
Averaging is necessary because the number of views on the site is displayed in increments of 100, which leads to a "ragged" schedule. In principle, this is not necessary, but with averaging it looks better. The code also adds the Moscow time zone (the time on the Raspberry Pi turned out to be GMT).
Finally, you can display the graphs and see what happened.
At the beginning of each graph there is an empty space, which is explained simply - when the script was launched, the articles were already published, so the data was not collected from scratch. The “zero” point was added manually from the description of the publication time of the article.
All the laid out charts are generated by matplotlib and the above code.
According to the results, I divided the studied articles into 3 groups. The division is conditional, although there is some sense in it.
This is an article on some popular and relevant topic, with a title like "How MTS writes off money" or "Roskomnadzor blockedporn git hub".
Such articles have a large number of views and comments, but the "hype" lasts a maximum of several days. You can also see a slight difference in the growth of the number of views during the day and at night (but not as significant as expected - apparently, Habr is read from almost all time zones).
The number of likes grows quite significantly, while the number of bookmarks grows much slower. This is logical, because someone may like the article, but the specificity of the text is such that it is simply not needed to add to bookmarks.
The ratio of views and likes is approximately the same and is roughly 400: 1:
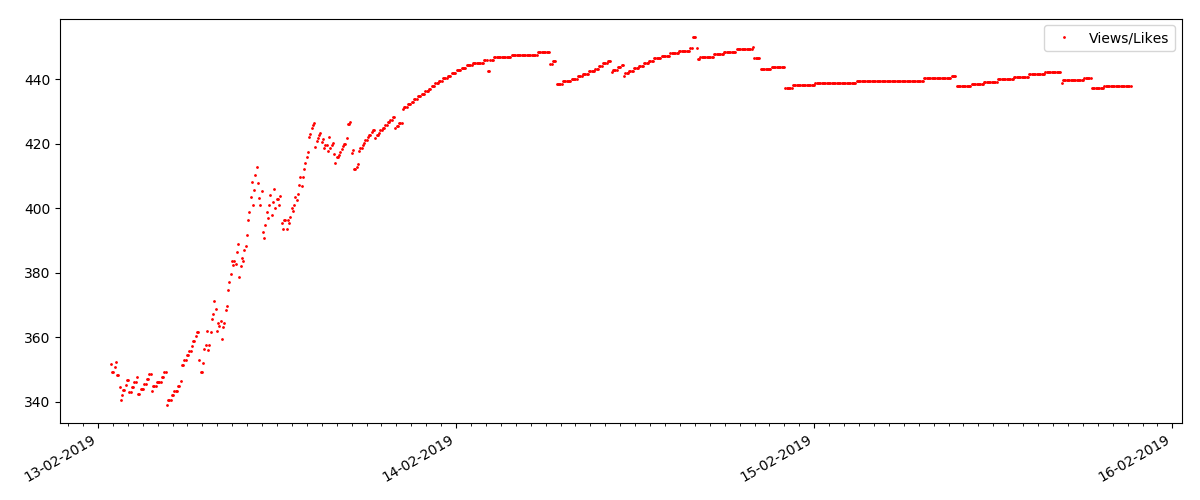
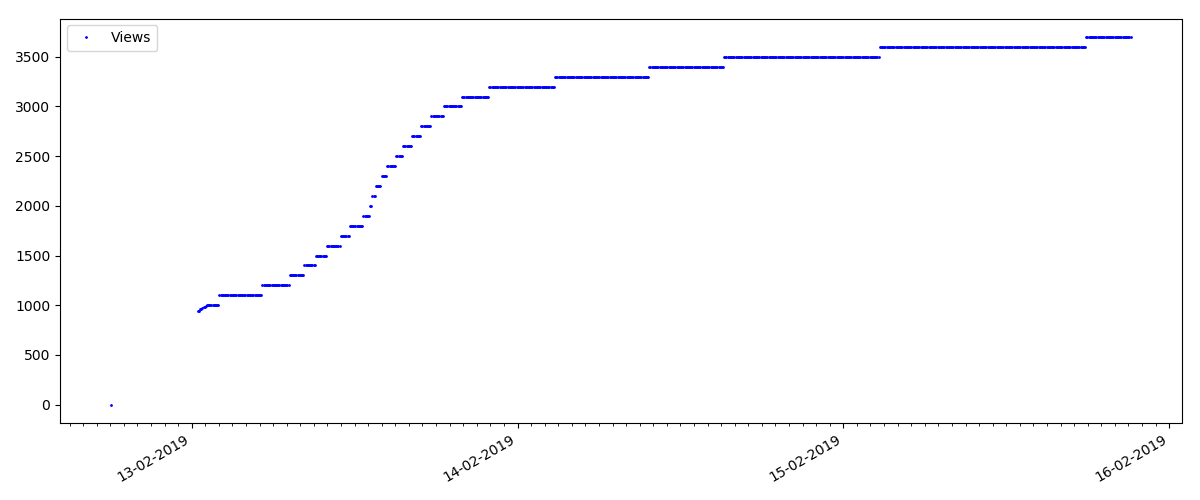
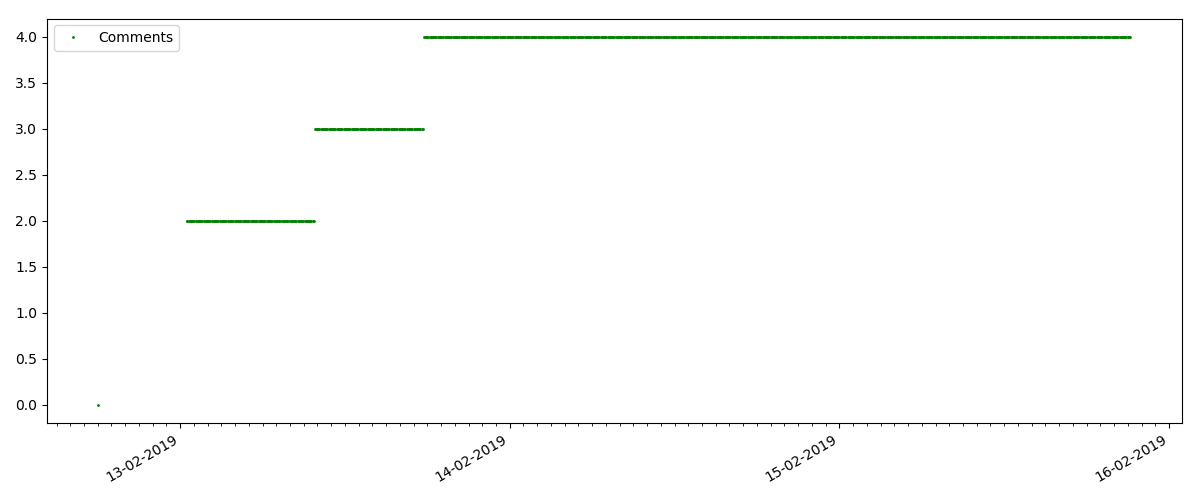
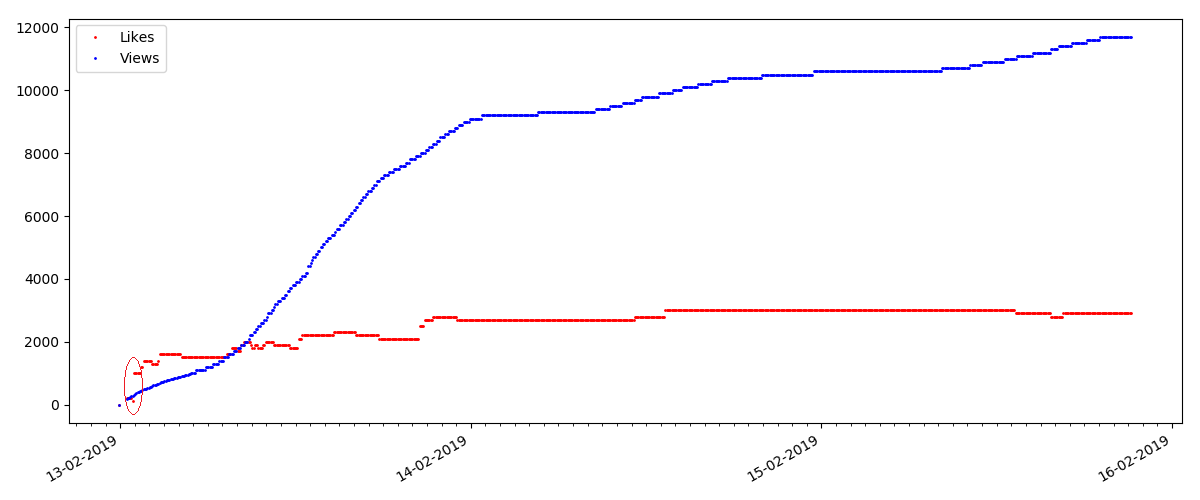
This is a more specialized article, such as "Configuring scripts for Node JS". Such an article, of course, is gaining at times less views than the “hot” one, the number of comments is also noticeably less (in this case there were only 4 of them).
But the next point is more interesting: the number of "likes" for such articles grows much slower than the number of "bookmarks". It is the opposite compared to the previous version - many people find the article useful to save for the future, but the reader doesn’t have to click like.
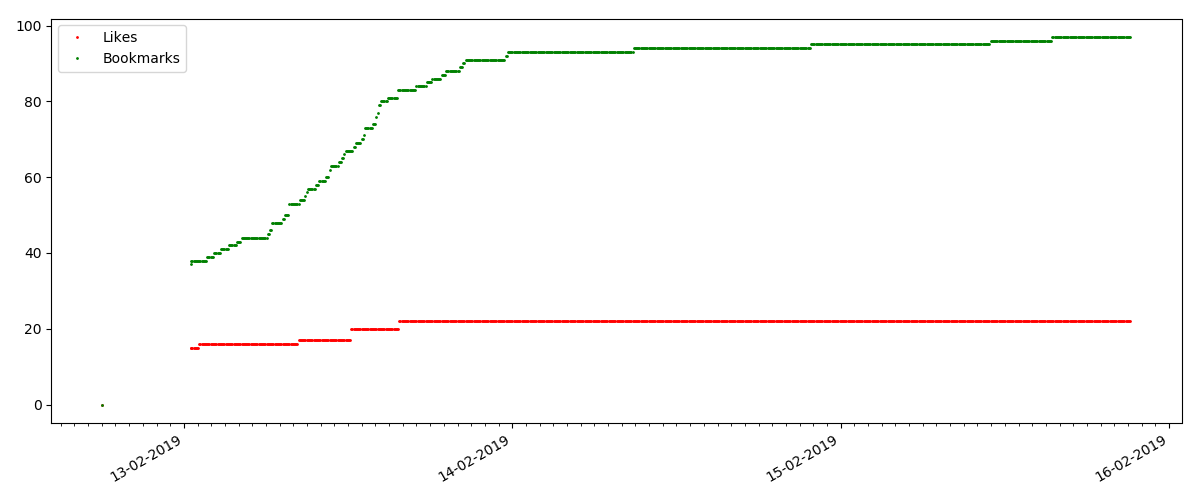
By the way, at this point I would like to draw the attention of the site administrators - when calculating the ratings of articles, it is worth counting “bookmarks” in parallel with “likes” (for example, combining sets by “OR”). Otherwise, this leads to a bias in the ranking, when a well-known good article has a lot of bookmarks added (i.e., readers definitely liked it), but these people forgot or were too lazy to click like.
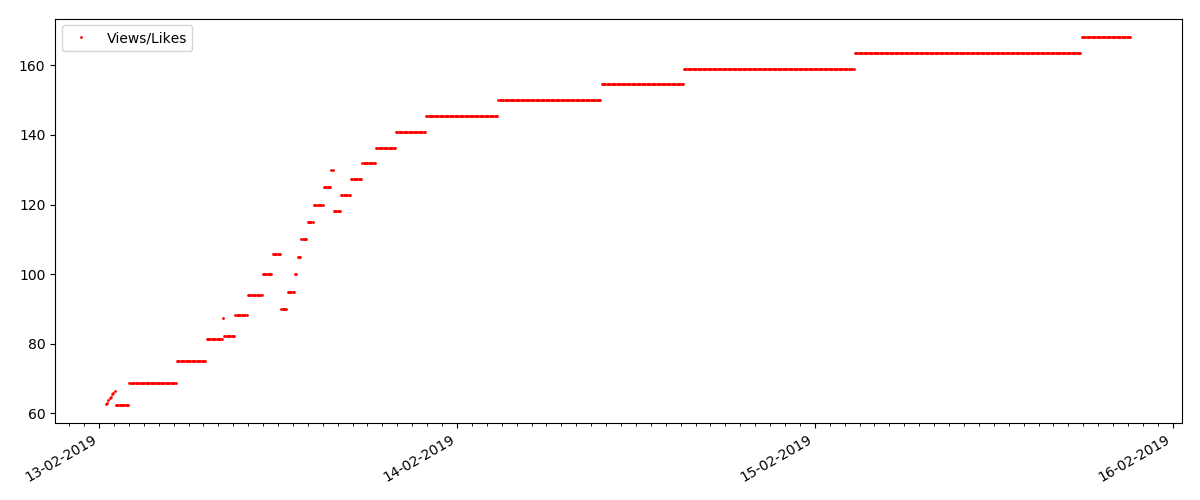
And finally, the ratio of views and likes: you can see that it is noticeably higher than in the first version and is roughly 150: 1, i.e. Quality of content indirectly can also be considered higher.
For the next article reviewed, the number of likes has increased by a third in the 5-minute interval (by 10 at once, with a total of 30 in all a few days).
It might be suspected cheating, but the "queuing theory" in principle allows for such bursts. Or maybe the author just sent the link to all his 10 friends, which of course is not prohibited by the rules.
The main conclusion - everything is ashes and maya. Even the most popular material, gaining thousands of views, will go “past” in just 3-4 days. Such, alas, is the specificity of the modern Internet, and probably the entire modern media industry as a whole. And I am sure that the figures shown are specific not only for Habr, but also for any similar Internet resource.
As for the rest, this analysis has a rather “Friday” character, and, of course, does not pretend to serious research. I also hope someone found something new in the use of Pandas and Matplotlib.
Thanks for attention.
Many regular readers and authors of the site probably thought about the life cycle of articles published here. Although it is intuitively more or less clear (for example, it is obvious that the article on the first page has the maximum number of views), but how much exactly?
To collect statistics, use Python, Pandas, Matplotlib and Raspberry Pi.
Those who are interested in what came out of this, please under the cat.
Data collection
To begin with we will be defined with metrics - that we want to learn. Everything is simple, each article has 4 main parameters displayed on the page - this is the number of views, likes, bookmarks and comments. We will analyze them.
Those who want to see the results immediately, can go to the third part, but for now it will be about programming.
The general plan: parse the necessary data from the web page, save it with CSV, and see what we did for a period of several days. To get started, let's download the text of the article (exception handling is omitted for clarity):
link = "https://habr.com/ru/post/000001/"
f = urllib.urlopen(link)
data_str = f.read()
Now, from the data_str line (of course, in HTML) you need to extract the data. Open the source code in the browser (non-basic elements are removed):
<ulclass="post-stats post-stats_post js-user_"id="infopanel_post_438514"><liclass="post-stats__item post-stats__item_voting-wjt"><spanclass="voting-wjt__counter voting-wjt__counter_positive js-score"title="Общий рейтинг 448: ↑434 и ↓14">+420</span></li><spanclass="btn_inner"><svgclass="icon-svg_bookmark"width="10"height="16"><usexlink:href="https://habr.com/images/1550155671/common-svg-sprite.svg#book" /></svg><spanclass="bookmark__counter js-favs_count"title="Количество пользователей, добавивших публикацию в закладки">320</span></span><liclass="post-stats__item post-stats__item_views"><divclass="post-stats__views"title="Количество просмотров"><spanclass="post-stats__views-count">219k</span></div></li><liclass="post-stats__item post-stats__item_comments"><ahref="https://habr.com/ru/post/438514/#comments"class="post-stats__comments-link" <spanclass="post-stats__comments-count"title="Читать комментарии">577</span></a></li><liclass="post-stats__item"><spanclass="icon-svg_report"><svgclass="icon-svg"width="32"height="32"viewBox="0 0 32 32"aria-hidden="true"version="1.1"role="img"><pathd="M0 0h32v32h-32v-32zm14 6v12h4v-12h-4zm0 16v4h4v-4h-4z"/></svg></span></li></ul>It is easy to see that the text we need is inside the block '<ul class = "post-stats post-stats_post js-user_>', and the necessary elements are in the blocks with the names voting-wjt__counter, bookmark__counter, post-stats__views-count and post- stats__comments-count. By name, everything is quite obvious.
Inherit the class str and add to it a method for extracting a substring between two tags:
classStr(str):deffind_between(self, first, last):try:
            start = self.index(first) + len(first)
            end = self.index(last, start)
            return Str(self[start:end])
        except ValueError:
            return Str("")
It was possible to do without inheritance, but this will allow you to write a more concise code. With it, all data extraction fits into 4 lines:
votes = data_str.find_between('span class="voting-wjt__counter voting-wjt__counter_positive  js-score"', 'span').find_between('>', '<')
bookmarks = data_str.find_between('span class="bookmark__counter js-favs_count"', 'span').find_between('>', '<')
views = data_str.find_between('span class="post-stats__views-count"', 'span').find_between('>', '<')
comments = data_str.find_between('span class="post-stats__comments-count"', 'span').find_between('>', '<')
But that is not all. As you can see, the number of comments or views can be stored as a string of type “12.1k”, which is not directly translated to int.
Add a function to convert such a string into a number:
defto_int(self):
    s = self.lower().replace(",", ".")
    if s[-1:] == "k":
        # "1.23k" => 1.23*1000 => 1230return int(1000*float(s.replace("k", "")))
    return int(self)
It remains only to add the timestamp, and you can save the data in csv:
timestamp = strftime("%Y-%m-%dT%H:%M:%S.000", gmtime())
str_out = "{},votes:{},bookmarks:{},views:{},comments:{};".format(timestamp, votes.to_int(), bookmarks.to_int(), views.to_int(), comments.to_int())
Since we are interested in analyzing several articles, we will add the ability to specify a link via the command line. We will also form the name of the log file by the article ID:
link = sys.argv[1]  # "https://habr.com/ru/post/000001/"
link_path = urlparse.urlparse(link.strip("/")).path  # https://habr.com/ru/post/000001/ => /ru/post/000001
link_parts = os.path.split(link_path)  # /ru/post/000001=> ('/ru/post', '000001')
log_file = "habr_log%s.txt" % link_parts[1]
And the very last step. We print the code in the function, loop through the data, and write the results to the log.
delay_s = 5*60whileTrue:
    # Get data
    data_str = get_as_str(link)
    data_csv = extract_as_csv(data_str)
    print data_csv
    # Append data to logwith open(log_file, "a") as logfile:
        logfile.write(data_csv + '\n')
    sleep(delay_s)
As you can see, the data update is done every 5 minutes in order not to create load on the server. I saved the program file as habr_parse.py, when it starts it will save data until the program is closed.
Further, it is desirable to save the data, at least for several days. Since keep the computer turned on for several days reluctantly, take the Raspberry Pi - its power for such a task is enough without any problems, and unlike in the PC, the Raspberry Pi does not make noise and almost does not consume electricity. Go through SSH and run our script:
nohup python habr_parse.py https://habr.com/ru/post/0000001/ &
The nohup command leaves the script to work in the background after closing the console.
As a bonus, you can run an http server in the background by entering the command „nuhup python -m SimpleHTTPServer 8000 &“. This will allow you to view the results directly in the browser at any time, opening the link of the form http://192.168.1.101:8000 (the address may of course be different).
Now you can leave the Raspberry Pi enabled, and return to the project in a few days.
Data analysis
If everything was done correctly, then the output should be something like this log:
2019-02-12T22:26:28.000,votes:12,bookmarks:0,views:448,comments:1;
2019-02-12T22:31:29.000,votes:12,bookmarks:0,views:467,comments:1;
2019-02-12T22:36:30.000,votes:14,bookmarks:1,views:482,comments:1;
2019-02-12T22:41:30.000,votes:14,bookmarks:2,views:497,comments:1;
2019-02-12T22:46:31.000,votes:14,bookmarks:2,views:513,comments:1;
2019-02-12T22:51:32.000,votes:14,bookmarks:2,views:527,comments:1;
2019-02-12T22:56:32.000,votes:14,bookmarks:2,views:543,comments:1;
2019-02-12T23:01:33.000,votes:14,bookmarks:2,views:557,comments:2;
2019-02-12T23:06:34.000,votes:14,bookmarks:2,views:567,comments:3;
2019-02-12T23:11:35.000,votes:13,bookmarks:2,views:590,comments:4;
...
2019-02-13T02:47:03.000,votes:15,bookmarks:3,views:1100,comments:20;
2019-02-13T02:52:04.000,votes:15,bookmarks:3,views:1200,comments:20;
Let's see how it can be processed. First, load the csv into the pandas dataframe:
import pandas as pd
import numpy as np
import datetime
log_path = "habr_data.txt"
df = pd.read_csv(log_path, header=None, names=['datetime', 'votes', 'bookmarks', 'views', 'comments'])
Add functions for converting and averaging, and extract the necessary data:
defto_float(s):# "bookmarks:22" => 22.0
    num = ''.join(i for i in s if i.isdigit())
    return float(num)
defrunning_mean(l, N=2):
    sum = 0
    result = len(l)*[0]
    for i in range(0, N):
        sum = sum + l[i]
        result[i] = sum / (i + 1)
    for i in range(N, len(l)):
        sum = sum - l[i - N] + l[i]
        result[i] = sum / N
    return result
log_path = "habr_data.txt"
df = pd.read_csv(log_path, header=None, names=['datetime', 'votes', 'bookmarks', 'views', 'comments'])
print df.head()
dates = pd.to_datetime(df['datetime'], format='%Y-%m-%dT%H:%M:%S.%f')
dates += datetime.timedelta(hours=3)
views = df["views"].map(to_float, na_action=None)
views_avg = running_mean(views.values.tolist())
votes = df["votes"].map(to_float, na_action=None)
bookmarks = df["bookmarks"].map(to_float, na_action=None)
comments = df["comments"].map(to_float, na_action=None)
viewspervotes = views/votes
viewsperbookmarks = views/bookmarks
Averaging is necessary because the number of views on the site is displayed in increments of 100, which leads to a "ragged" schedule. In principle, this is not necessary, but with averaging it looks better. The code also adds the Moscow time zone (the time on the Raspberry Pi turned out to be GMT).
Finally, you can display the graphs and see what happened.
import matplotlib.pyplot as plt
# Draw
fig, ax = plt.subplots()
# plt.plot(dates, votes, 'ro', markersize=1, label='Votes')# plt.plot(dates, bookmarks, 'go', markersize=1, label='Bookmarks')# plt.plot(dates, comments, 'go', markersize=1, label='Comments')
ax.plot(dates, views_avg, 'bo', markersize=1, label='Views')
# plt.plot(dates, views_g, 'bo', markersize=1, label='Views')# plt.plot(dates, viewspervotes, 'ro', markersize=1, label='Views/Votes')# plt.plot(dates, viewsperbookmarks, 'go', markersize=1, label='Views/Bookmarks')
ax.xaxis.set_major_formatter(mdates.DateFormatter("%d-%d-%Y"))
ax.xaxis.set_major_locator(mdates.DayLocator())
ax.xaxis.set_minor_locator(mdates.HourLocator(interval=1))
fig.autofmt_xdate()
plt.legend(loc='best')
plt.xticks(rotation=45, ha="right")
plt.tight_layout()
plt.show()
results
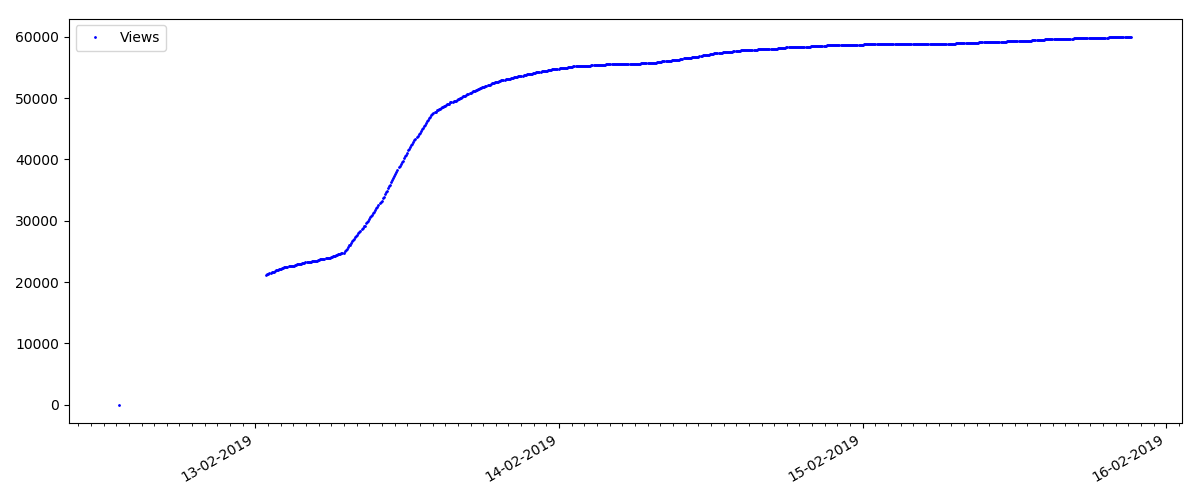
At the beginning of each graph there is an empty space, which is explained simply - when the script was launched, the articles were already published, so the data was not collected from scratch. The “zero” point was added manually from the description of the publication time of the article.
All the laid out charts are generated by matplotlib and the above code.
According to the results, I divided the studied articles into 3 groups. The division is conditional, although there is some sense in it.
"Hot" article
This is an article on some popular and relevant topic, with a title like "How MTS writes off money" or "Roskomnadzor blocked
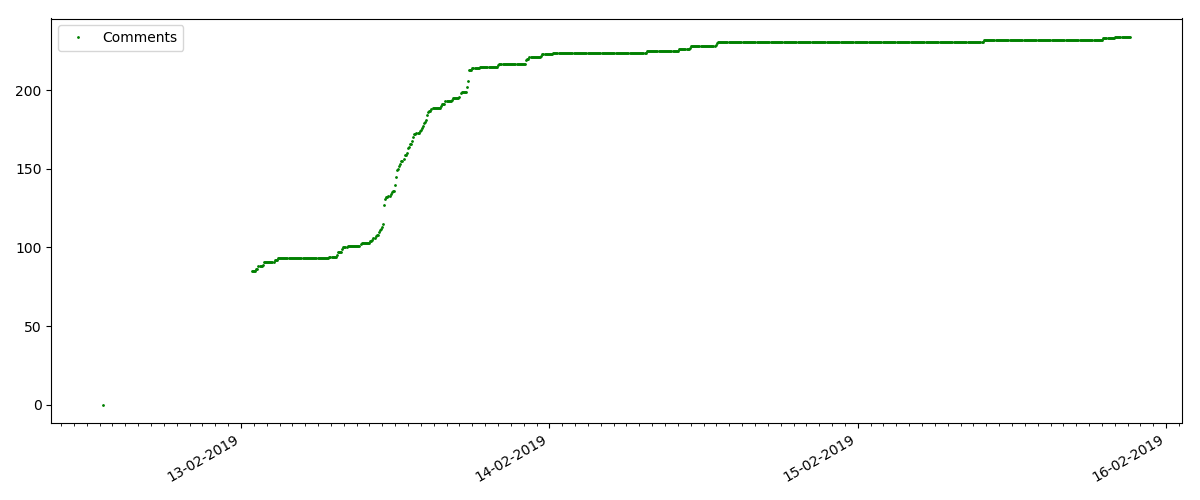
Such articles have a large number of views and comments, but the "hype" lasts a maximum of several days. You can also see a slight difference in the growth of the number of views during the day and at night (but not as significant as expected - apparently, Habr is read from almost all time zones).
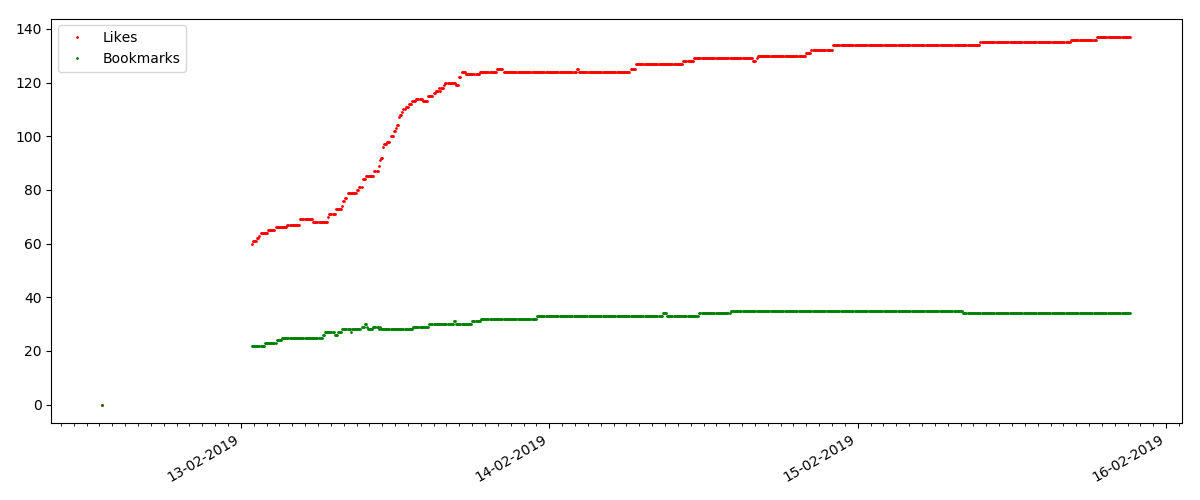
The number of likes grows quite significantly, while the number of bookmarks grows much slower. This is logical, because someone may like the article, but the specificity of the text is such that it is simply not needed to add to bookmarks.
The ratio of views and likes is approximately the same and is roughly 400: 1:
"Technical" article
This is a more specialized article, such as "Configuring scripts for Node JS". Such an article, of course, is gaining at times less views than the “hot” one, the number of comments is also noticeably less (in this case there were only 4 of them).
But the next point is more interesting: the number of "likes" for such articles grows much slower than the number of "bookmarks". It is the opposite compared to the previous version - many people find the article useful to save for the future, but the reader doesn’t have to click like.
By the way, at this point I would like to draw the attention of the site administrators - when calculating the ratings of articles, it is worth counting “bookmarks” in parallel with “likes” (for example, combining sets by “OR”). Otherwise, this leads to a bias in the ranking, when a well-known good article has a lot of bookmarks added (i.e., readers definitely liked it), but these people forgot or were too lazy to click like.
And finally, the ratio of views and likes: you can see that it is noticeably higher than in the first version and is roughly 150: 1, i.e. Quality of content indirectly can also be considered higher.
“Suspicious” article (but this is not accurate)
For the next article reviewed, the number of likes has increased by a third in the 5-minute interval (by 10 at once, with a total of 30 in all a few days).
It might be suspected cheating, but the "queuing theory" in principle allows for such bursts. Or maybe the author just sent the link to all his 10 friends, which of course is not prohibited by the rules.
findings
The main conclusion - everything is ashes and maya. Even the most popular material, gaining thousands of views, will go “past” in just 3-4 days. Such, alas, is the specificity of the modern Internet, and probably the entire modern media industry as a whole. And I am sure that the figures shown are specific not only for Habr, but also for any similar Internet resource.
As for the rest, this analysis has a rather “Friday” character, and, of course, does not pretend to serious research. I also hope someone found something new in the use of Pandas and Matplotlib.
Thanks for attention.