Kalman filter to minimize the entropy value of random error with non-Gaussian distribution
- Tutorial

Introduction
On Habr, the mathematical description of the work of the Kalman filter and the features of its application were considered in the following publications [1 ÷ 10]. In the publication [2], the algorithm of the Kalman filter (FC) in the state space model is considered in a simple and intelligible form. It should be noted that the study of control systems and control in the time domain using state variables has been widely used recently due to the simplicity of the analysis [eleven].
Publication [8] is of considerable interest just for learning. The author’s methodical technique is very effective, he began his article by considering the Gauss random error distribution, considered the FC algorithm and finished with a simple iteration formula for selecting the FC gain coefficient. The author confined himself to considering the Gauss distribution, motivating this by the fact that for sufficiently large
Theoretically, such an assertion is certainly true, but in practice the number of measurements at each point of the range cannot be very large. RE Kalman himself obtained results on the minimum covariance of the filter based on orthogonal projections, without assuming that the measurement errors are Gaussian [12].
The purpose of this publication is to investigate the capabilities of the Kalman filter to minimize the entropy value of the random error with a non-Gaussian distribution.
To assess the effectiveness of the Kalman filter in identifying the distribution law or by superposing laws based on experimental data, we use the information theory of measurements based on the information theory of C. Shannon, according to which information, like a physical quantity, can be measured and evaluated.
The main advantage of the information approach to the description of measurements is that the size of the entropy uncertainty interval can be found strictly mathematically for any distribution law. This eliminates the historically established arbitrariness, which is unavoidable with the volitional assignment of different values of the confidence probability. This is especially important in the educational process, when a teacher can observe a decrease in measurement uncertainty when applying Kalman filtering on a given numerical sample [13,14].
In addition, the set of probabilistic and informational characteristics of the sample can more accurately determine the nature of the distribution of random error. This is explained by the extensive base of the numerical values of such parameters as the entropy coefficient and the counter-process for the various distribution laws and their superposition.
Evaluation of the superposition of the laws of the distribution of a random variable according to the entropy coefficient and the counter-process (obtained from experimental data)
The density of the probability distribution for each column of the histogram [14] width
Imagine an expression for the estimation of entropy in the form:
We obtain an expression for estimating the entropy value of a random variable:
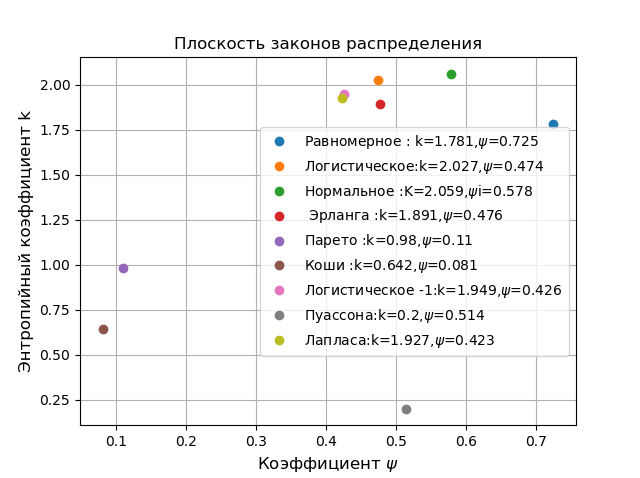
The classification of the distribution laws is carried out on the plane in the coordinates of the entropy coefficient
For all possible distribution laws, \ psi varies from 0 to 1, and k from 0 to 2.066, so each law can be characterized by a certain point. Let's show it using the following program:
Plane of distribution laws
import matplotlib.pyplot as plt
from numpy import*
from scipy.stats import *
defgraf(a):#группировка данных
         a.sort()
         n=len(a)
         m= int(10+sqrt(n))
         d=(max(a)-min(a))/m
         x=[];y=[]
         for i in arange(0,m,1):
                  x.append(min(a)+d*i)
                  k=0for j in a:
                           if min(a)+d*i <=j<min(a)+d*(i+1):
                                    k=k+1
                  y.append(k)
         h=(1+0.5*m/n)*0.5*d*n*10**(-sum([w*log10(w) for w in y if w!=0])/n)
         k=h/std (a)
         mu4=sum ([(w-mean (a))**4for w in a])/n
         psi=(std(a))**2/sqrt(mu4)
         return  psi,k
b=800#объём контрольной выборки
plt.title('Плоскость законов распределения', size=12)
plt.xlabel('Коэффициент $\psi$', size=12)
plt.ylabel('Энтропийный коэффициент k', size=12)
a=uniform.rvs( size=b)
psi,k,=graf(a)
nr="Равномерное : k=%s,$\psi$=%s "%(round(k,3),round(psi,3))
plt.plot(psi,k,'o',  label=nr)
a=logistic.rvs( size=b)
psi,k,=graf(a)
nr="Логистическое:k=%s,$\psi$=%s "%(round(k,3),round(psi,3))
plt.plot(psi,k,'o',  label=nr)
a=norm.rvs( size=b)
psi,k,=graf(a)
nr="Нормальное :K=%s,$\psi$i=%s "%(round(k,3),round(psi,3))
plt.plot(psi,k,'o',   label=nr)
a= erlang.rvs(4,size=b)
psi,k,=graf(a)
nr=" Эрланга :k=%s,$\psi$=%s "%(round(k,3),round(psi,3))
plt.plot(psi,k, 'o',  label=nr)
a= pareto.rvs(4,size=b)
psi,k,=graf(a)
nr="Парето :k=%s,$\psi$=%s "%(round(k,3),round(psi,3))
plt.plot(psi,k, 'o',  label=nr)
a = cauchy.rvs(size=b)
psi,k,=graf(a)
nr="Коши :k=%s,$\psi$=%s "%(round(k,3),round(psi,3))
plt.plot(psi,k,'o',   label=nr)
c = 0.412
a = genlogistic.rvs(c, size=b)
psi,k,=graf(a)
nr="Логистическое -1:k=%s,$\psi$=%s "%(round(k,3),round(psi,3))
plt.plot(psi,k,'o',   label=nr)
mu=0.6
a = poisson.rvs(mu, size=b)
psi,k,=graf(a)
nr="Пуассона:k=%s,$\psi$=%s "%(round(k,3),round(psi,3))
plt.plot(psi,k,'o',   label=nr)
a= laplace.rvs(size=b)
psi,k,=graf(a)
nr="Лапласа:k=%s,$\psi$=%s "%(round(k,3),round(psi,3))
plt.plot(psi,k,'o',   label=nr)
plt.legend(loc='best')
plt.grid()
plt.show()

On a plane in coordinates
Selection of the Kalman filter algorithm
At each selected point of the measurement range, multiple measurements are taken and their result is compared with the measure that the FC does not know. Therefore, you should choose the FC, for example Kalman Filter to Estimate a Constant [16]. However, I prefer Python and settled on option [16] with extensive documentation. I will give a description of the algorithm:
Since the constant is always one model of the system can be represented as:
For the model, the transition matrix degenerates into one, and the control matrix to zero. The measurement model takes the form:
For model (2), the matrix of measurements turns into a unit, and the covariance matrices
Equation (3) shows that the a priori estimate in the next step is equal to the a posteriori estimate made in the previous step. A priori error variance estimate:
By a priori state assessment
After the next measurement is received
The filter adjusts its estimate of the state of the system by choosing a point somewhere between the initial estimate
where
The error variance estimate is also corrected:
It can be shown that the variance of the error
The gain of the filter at which the minimum error of the estimation of the state of the system is reached is determined from the relationship:
Minimizing the entropy error of the FK for noise with the Cauchy, Pareto and Gauss
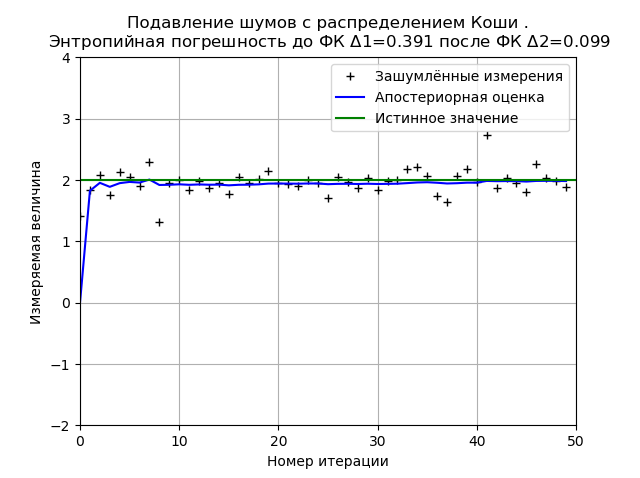
distribution 1. In probability theory, the Cauchy distribution density is determined from the relation:
For this distribution it is impossible to estimate the error by the methods of probability theory (
The program of minimization of the FC entropy error due to Cauchy noise
from numpy import *
import matplotlib.pyplot as plt
from scipy.stats import *
defgraf(a):#группировка данных для определения энтропийной погрешности
         a.sort()
         n=len(a)
         m= int(10+sqrt(n))
         d=(max(a)-min(a))/m
         x=[];y=[]
         for i in arange(0,m,1):
                  x.append(min(a)+d*i)
                  k=0for j in a:
                           if min(a)+d*i <=j<min(a)+d*(i+1):
                                    k=k+1
                  y.append(k)
         h=(1+0.5*m/n)*0.5*d*n*10**(-sum([w*log10(w) for w in y if w!=0])/n)
         return  h
defKalman(a,x,sz,R1):
    R = R1*R1  # Дисперсия
    Q = 1e-5# Дисперсия случайной величины в модели системы # Выделение памяти под массивы:
    xest1 = zeros(sz)  # Априорная оценка состояния
    xest2 = zeros(sz)  # Апостериорная оценка состояния
    P1 = zeros(sz)     # Априорная  оценка ошибки
    P2 = zeros(sz)     # Апостериорная оценка ошибки
    G = zeros(sz)      # Коэффициент усиления фильтра
    xest2[0] = 0.0
    P2[0] = 1.0for k in arange(1, sz): # Цикл по отсчётам времени.
             xest1[k] = xest2[k-1] # Априорная оценка состояния.
             P1[k] = P2[k-1] + Q# Априорная оценка ошибки.# После получения нового значения измерения вычисляем апостериорные оценки :
             G[k] = P1[k] / ( P1[k] + R )
             xest2[k] = xest1[k] + G[k] * ( a[k] - xest1[k] )
             P2[k] = (1 - G[k]) * P1[k]
    return  xest2,P1
nr="распределением Коши "
x =2# Истинное значение измеряемой величины фильтру неизвестно)
R1 = 0.1# Ср . кв . ошибка измерения .
sz = 50# Число итераций.
a = cauchy.rvs(x, R1, size=sz)
xest2,P1=Kalman(a,x,sz,R1)
plt.plot(a, 'k+', label='Зашумлённые измерения')
plt.plot(xest2,'b-', label='Апостериорная оценка')
plt.axhline(x, color='g', label='Истинное значение')
plt.axis([0, sz,-x, 2*x])
plt.legend()
plt.xlabel('Номер итерации')
plt.ylabel(u'Измеряемая величина')
h1=graf(a)
h2=graf(xest2)
plt.title('Подавление шумов с %s.\n Энтропийная погрешность до ФК $\Delta $1=%s после ФК $\Delta $2=%s '%(nr,round(h1,3),round(h2,3)), size=12)
plt.grid()
plt.show()
The view of the graph may change both when the program is restarted (new generation of the distribution sample) and depending on the number of measurements and distribution parameters, but one thing remains the same; the FK minimizes the value of the entropy error calculated on the basis of the information theory of measurements. For the above graph, FC reduces the entropy error by 3.9 times.
2. In probability theory, the Pareto distribution density with parameters
It should be noted that the Pareto distribution is found not only in the economy. You can give the following example of the distribution of the file size in Internet traffic by TCP protocol.
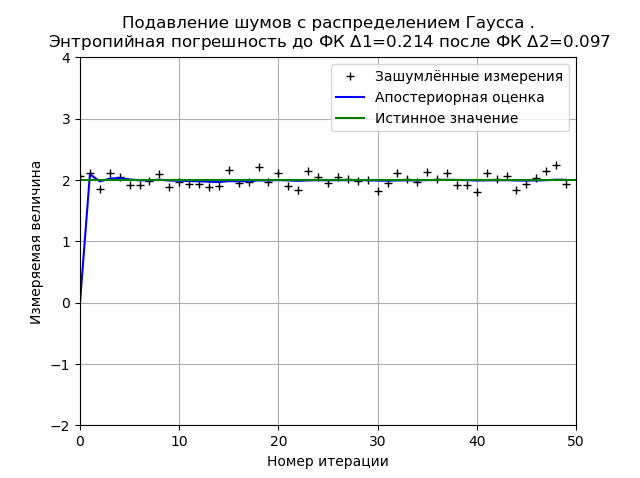
3. In probability theory, the density of the normal distribution (Gauss) with the expectation
The definition of the FK minimization of the entropy error from noise with the Gaussian distribution is given for comparison with the non-Gaussian Cauchy and Pareto distributions.
The program of minimization of the FK entropy error from the noise of the normal distribution
from numpy import *
import matplotlib.pyplot as plt
from scipy.stats import *
defgraf(a):#группировка данных для определения энтропийной погрешности
         a.sort()
         n=len(a)
         m= int(10+sqrt(n))
         d=(max(a)-min(a))/m
         x=[];y=[]
         for i in arange(0,m,1):
                  x.append(min(a)+d*i)
                  k=0for j in a:
                           if min(a)+d*i <=j<min(a)+d*(i+1):
                                    k=k+1
                  y.append(k)
         h=(1+0.5*m/n)*0.5*d*n*10**(-sum([w*log10(w) for w in y if w!=0])/n)
         return  h
defKalman(a,x,sz,R1):
    R = R1*R1  # Дисперсия
    Q = 1e-5# Дисперсия случайной величины в модели системы # Выделение памяти под массивы:
    xest1 = zeros(sz)  # Априорная оценка состояния
    xest2 = zeros(sz)  # Апостериорная оценка состояния
    P1 = zeros(sz)     # Априорная  оценка ошибки
    P2 = zeros(sz)     # Апостериорная оценка ошибки
    G = zeros(sz)      # Коэффициент усиления фильтра
    xest2[0] = 0.0
    P2[0] = 1.0for k in arange(1, sz): # Цикл по отсчётам времени.
             xest1[k] = xest2[k-1] # Априорная оценка состояния.
             P1[k] = P2[k-1] + Q# Априорная оценка ошибки.# После получения нового значения измерения вычисляем апостериорные оценки :
             G[k] = P1[k] / ( P1[k] + R )
             xest2[k] = xest1[k] + G[k] * ( a[k] - xest1[k] )
             P2[k] = (1 - G[k]) * P1[k]
    return  xest2,P1
nr="распределением Гаусса "
x =2# Истинное значение измеряемой величины фильтру неизвестно)
R1 = 0.1# Ср . кв . ошибка измерения .
sz = 50# Число итераций.
a=norm.rvs( x, R1, size=sz)
xest2,P1=Kalman(a,x,sz,R1)
plt.plot(a, 'k+', label='Зашумлённые измерения')
plt.plot(xest2,'b-', label='Апостериорная оценка')
plt.axhline(x, color='g', label='Истинное значение')
plt.axis([0, sz,-x, 2*x])
plt.legend()
plt.xlabel('Номер итерации')
plt.ylabel(u'Измеряемая величина')
h1=graf(a)
h2=graf(xest2)
plt.title('Подавление шумов с %s.\n Энтропийная погрешность до ФК $\Delta $1=%s после ФК $\Delta $2=%s '%(nr,round(h1,3),round(h2,3)), size=12)
plt.grid()
plt.show()
The Gaussian distribution provides a higher stability of the result with 50 measurements and for the given graph the entropy error decreases 2.2 times.
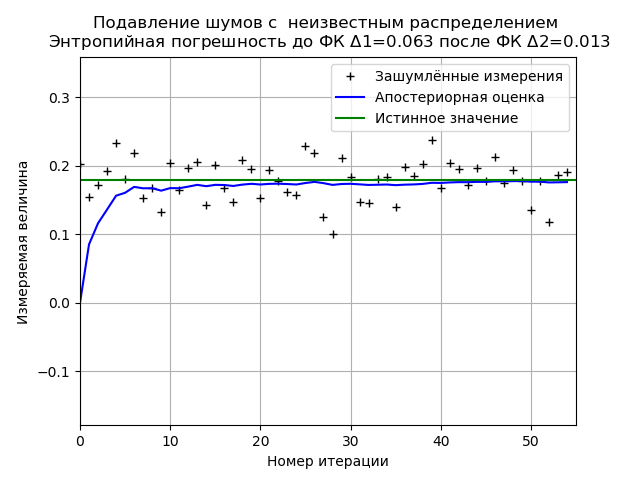
Minimization of the FC of entropy error in a sample of experimental data with an unknown noise distribution law
The program of minimization of the FK entropy error of a limited sample of experimental data
from numpy import *
import matplotlib.pyplot as plt
from scipy.stats import *
defgraf(a):#группировка данных для определения энтропийной погрешности
         a.sort()
         n=len(a)
         m= int(10+sqrt(n))
         d=(max(a)-min(a))/m
         x=[];y=[]
         for i in arange(0,m,1):
                  x.append(min(a)+d*i)
                  k=0for j in a:
                           if min(a)+d*i <=j<min(a)+d*(i+1):
                                    k=k+1
                  y.append(k)
         h=(1+0.5*m/n)*0.5*d*n*10**(-sum([w*log10(w) for w in y if w!=0])/n)
         k=h/std (a)
         mu4=sum ([(w-mean (a))**4for w in a])/n
         psi=(std(a))**2/sqrt(mu4)
         return  h
defKalman(a,x,sz,R1):
    R = R1*R1  # Дисперсия
    Q = 1e-5# Дисперсия случайной величины в модели системы # Выделение памяти под массивы:
    xest1 = zeros(sz)  # Априорная оценка состояния
    xest2 = zeros(sz)  # Апостериорная оценка состояния
    P1 = zeros(sz)     # Априорная  оценка ошибки
    P2 = zeros(sz)     # Апостериорная оценка ошибки
    G = zeros(sz)      # Коэффициент усиления фильтра
    xest2[0] = 0.0
    P2[0] = 1.0for k in arange(1, sz): # Цикл по отсчётам времени.
             xest1[k] = xest2[k-1] # Априорная оценка состояния.
             P1[k] = P2[k-1] + Q# Априорная оценка ошибки.# После получения нового значения измерения вычисляем апостериорные оценки :
             G[k] = P1[k] / ( P1[k] + R )
             xest2[k] = xest1[k] + G[k] * ( a[k] - xest1[k] )
             P2[k] = (1 - G[k]) * P1[k]
    return  xest2,P1
R1 = 0.9# Ср . кв . ошибка измерения .
a=[ 0.203, 0.154, 0.172, 0.192, 0.233, 0.181, 0.219, 0.153, 0.168, 0.132, 0.204, 0.165, 0.197, 0.205, 0.143,   0.201, 0.168, 0.147, 0.208, 0.195, 0.153, 0.193, 0.178, 0.162, 0.157, 0.228, 0.219, 0.125, 0.101, 0.211,0.183, 0.147,    0.145, 0.181,0.184, 0.139, 0.198, 0.185, 0.202, 0.238, 0.167, 0.204, 0.195, 0.172, 0.196, 0.178, 0.213, 0.175, 0.194,   0.178, 0.135, 0.178, 0.118, 0.186, 0.191]
sz = len(a)   # Число итераций
x =0.179# Истинное значение измеряемой величины фильтру неизвестно)
xest2,P1=Kalman(a,x,sz,R1)
plt.plot(a, 'k+', label='Зашумлённые измерения')
plt.plot(xest2,'b-', label='Апостериорная оценка')
plt.axhline(x, color='g', label='Истинное значение')
plt.axis([0, sz,-x, 2*x])
plt.legend()
plt.xlabel('Номер итерации')
plt.ylabel('Измеряемая величина')
h1=graf(a)
nr=" неизвестным распределением"
h2=graf(xest2)
plt.title('Подавление шумов с %s \n Энтропийная погрешность до ФК $\Delta $1=%s после ФК $\Delta $2=%s '%(nr,round(h1,3),round(h2,3)), size=12)
plt.grid()
plt.show()
When analyzing a sample of experimental data, we obtain stable results on minimizing the PK of entropy error. For this sample, the FC reduces the entropy error by 4.85 times.
Conclusion
All comparisons given in this article were carried out on limited data samples, therefore, we should refrain from fundamental conclusions, however, the use of entropy error allows us to quantify the effectiveness of the Kalman filter in the above implementation, therefore the training task of this article can be considered complete.
Links
1. Неортогональная БИНС для малых БПЛА
2. Фильтр Калмана — !cложно?
3. Без запаха фильтрации и нелинейного оценивания *
4. На пороге дополненной реальности: к чему готовиться разработчикам (часть 2 из 3)
5. Классическая механика: о диффурах «на пальцах»
6. Фильтр Калмана — Введение
7. Генератор Федеративного Фильтра Калмана с использованием Генетических Алгоритмов.
8. Фильтр Калмана
9. Использование фильтра Калмана для определения производных измеряемой величины
10. Простая модель адаптивного фильтра Калмана средствами Python
11. Пространство состояний в задачах проектирования систем оптимального управления
12. A New Approach to Linear Filtering and Prediction Problems1
13. Вероятностный и информационный анализ результатов измерений на Python
14. Подбор закона распределения случайной величины по данным статистической выборки средствами Python
15. Kalman filtering
16. Kalman Filter to Estimate a Constant
