Your task switch logging in one day
At the dawn of my career, I had a chance to work with RTOS VxWorks and the Tornado development environment. The impressions were extremely positive (especially since now there is something to compare), but the post is not about that. An integral part of the system then was a system for collecting and visualizing information about switching tasks in real time. I must say right away that the thing is extremely useful, not for nothing that they say that it is better to see it once. For example, if you have at least two dozen tasks in your system, then with a confidence of 99% you can say that you will be very surprised when you see a visualization of task switching - it will be completely different from what you imagined.
The benefits, for example, of the fact that in the event of an unexpected crash, freeze or reboot, you can see the last moments of the system’s life, you don’t even have to say!
But what to do if you have to work with RTOS and an environment where there is no such convenient mechanism? Of course, do it yourself!
Part one, statistics collection.
Everything is simple here - we will need an accurate timer (microseconds or even more precisely) and some free space in memory. In memory, we allocate space for the array under the data (based on “one switch - taskId + time”), “hang up” on the OC event “task switching” (and on the input-output to / from the interrupt, if we want to track them too), and save the data (ID of the activated task and timer value) to an array (which is used as a circular buffer).
You can also implement "User-defined events" - write a function that, when called, will store values in this array to see when an event in the code exactly happens.
We realize the possibility of starting and stopping on-demand logging (CLI, calling a function ...) and the possibility of continuous logging (in order to track, for example, the last moments before a failure - after all, after a reboot, the stored data will be perfectly saved in memory, unless of course the memory is not cleared by force).
And, depending on the embedded system, we will implement some way of transferring this array from the embedded device to the PC, where we will visualize it. If the embedded system has a file system, it can be written to a file, if not, then some other option is sending over the network, for example. I used RS232 used in the system for debugging.
It remains to visualize the collected information. And here we don’t even have to write anything (or almost nothing). You can use the free Octave package, which can draw 2D graphics of functions and implements zoom-in - zoom-out (even if you collect data in just a couple of seconds, given that usually a task's quantum of time is 1 millisecond, without zoom you not enough).
All you need to do is convert the collected data to the Octave format:
y = [time1, time2, ..., timeN];
x = [task1, task2, ..., taskN];
plot (x, y)
grid on
Here timeX is time (in any units, it is more convenient to use, for example, micro- or milliseconds, and make time1 be 0), and taskX is the task ID (in principle, any number, but it’s more convenient, again, to sort tasks by priorities and normalize them so that their IDs are 1, 2, 3 ..., remembering what value has which task). If there are interrupts and user events, you can also think of something, for example, numbering user events with negative numbers.
How to make this conversion - everyone can choose for themselves (it is here that you will have to write your own code a bit).
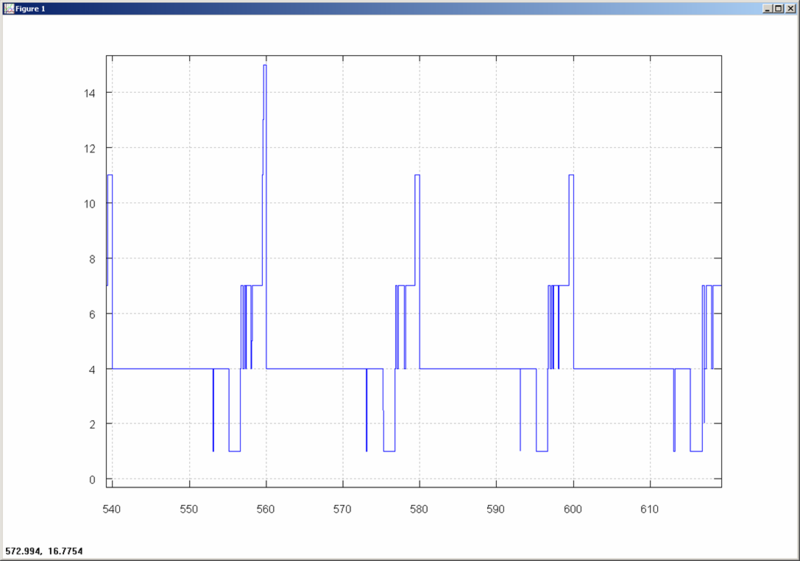
The result is something like this. This is how the system looked in idle state:
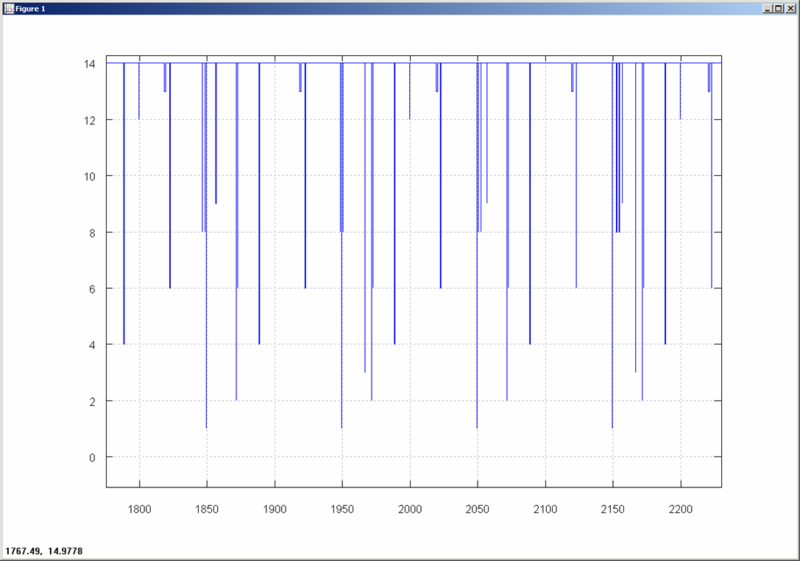
And here it is - fully loaded:
 "
"
It seems to me that the opportunity to see what is really happening in the system is worth the effort to spend a little time and do the above actions.
The professionally made solution from WindRiver was, of course, prettier, showing task names, not abstract IDs, and points on the graph showed interesting points ... But if it is not there, then it is better to have your own, though simpler, than not to have one.
The benefits, for example, of the fact that in the event of an unexpected crash, freeze or reboot, you can see the last moments of the system’s life, you don’t even have to say!
But what to do if you have to work with RTOS and an environment where there is no such convenient mechanism? Of course, do it yourself!
Part one, statistics collection.
Everything is simple here - we will need an accurate timer (microseconds or even more precisely) and some free space in memory. In memory, we allocate space for the array under the data (based on “one switch - taskId + time”), “hang up” on the OC event “task switching” (and on the input-output to / from the interrupt, if we want to track them too), and save the data (ID of the activated task and timer value) to an array (which is used as a circular buffer).
You can also implement "User-defined events" - write a function that, when called, will store values in this array to see when an event in the code exactly happens.
We realize the possibility of starting and stopping on-demand logging (CLI, calling a function ...) and the possibility of continuous logging (in order to track, for example, the last moments before a failure - after all, after a reboot, the stored data will be perfectly saved in memory, unless of course the memory is not cleared by force).
And, depending on the embedded system, we will implement some way of transferring this array from the embedded device to the PC, where we will visualize it. If the embedded system has a file system, it can be written to a file, if not, then some other option is sending over the network, for example. I used RS232 used in the system for debugging.
It remains to visualize the collected information. And here we don’t even have to write anything (or almost nothing). You can use the free Octave package, which can draw 2D graphics of functions and implements zoom-in - zoom-out (even if you collect data in just a couple of seconds, given that usually a task's quantum of time is 1 millisecond, without zoom you not enough).
All you need to do is convert the collected data to the Octave format:
y = [time1, time2, ..., timeN];
x = [task1, task2, ..., taskN];
plot (x, y)
grid on
Here timeX is time (in any units, it is more convenient to use, for example, micro- or milliseconds, and make time1 be 0), and taskX is the task ID (in principle, any number, but it’s more convenient, again, to sort tasks by priorities and normalize them so that their IDs are 1, 2, 3 ..., remembering what value has which task). If there are interrupts and user events, you can also think of something, for example, numbering user events with negative numbers.
How to make this conversion - everyone can choose for themselves (it is here that you will have to write your own code a bit).
The result is something like this. This is how the system looked in idle state:
And here it is - fully loaded:
"It seems to me that the opportunity to see what is really happening in the system is worth the effort to spend a little time and do the above actions.
The professionally made solution from WindRiver was, of course, prettier, showing task names, not abstract IDs, and points on the graph showed interesting points ... But if it is not there, then it is better to have your own, though simpler, than not to have one.