About modern methods of near-Earth astronomy
Lyrical entry
If an ancient man had fallen into our time and looked at the night sky, he would probably have started to pray to his gods immediately, or perhaps thought that the day of judgment had come. For us people whose sky is hidden behind the light pollution of cities and villages, such a statement may seem absurd: "Stars are the same stars, what to take from them?" But if you look, it will make sense. Go out in the evening to nature and look at the sky. Can't see anything? Watch carefully! At almost any moment, 2-3 bright points will fly across the sky, and if you look closely, you can still find from the heels more slow and dull. Sometimes (3-4 times per night) you may be lucky and you will see a brightest flash
in the sky, only the moon is equal in brightness to it. All these are the achievements of human progress - satellites. For an ancient man, for whom the sky was a symbol of permanence, which he sees above himself from night to night, all this fuss would be perceived as something unnatural.
Pragmatic entry
Habroyzer - he is not an antique person and for the most part he does not understand stars. And even if he takes advantage of special software and literature , then he will need to learn more than a week of sticking into the sky and cramming ancient legends to understand the level of the ancients. But, Habroyuser, he is a modern man, technically savvy and, for the most part, versed in science. And this means that among the ancients he could be considered a wise man - a fortuneteller who knows how to predict the appearance of these new-fashioned flying stars. If I knew how to do it. But I’ll tell you exactly how this is done today.
Introduction
All I will write here is fairly well-known algorithms, many of which are used in other problems. Most astronomers are familiar with them one way or another, and especially advanced ones even know how to use them. For these people, they will read this opus, I’ll immediately make a reservation: among the many algorithms I choose those that are, in my opinion, the simplest and most interesting. If you propose to rewrite some of the parts more simply / interestingly, I will gladly post your version. Also, I’ll immediately make a reservation that everything that is located here refers specifically to “Popular Science,” I won’t go into the depths of matan. For those who are not interested in the non-fiction part, you can immediately go to the ending, there is a list of programs with which you can play.
The task of predicting the trajectory of satellites appeared a long time ago, with the launch of the first satellite. But in those days, it was still impossible to accurately predict the factors influencing the flight, so forecasting was crude. But over time, this science developed and was able to create systems such as GPS, which position you with an accuracy of several meters.
I did not see other popular science articles on a subject not anywhere else elsewhere. Although specialized information is full. And since there were blanks for one manual on the computer, I decided to simplify the information available there, structure it and put it here.
The basics
Surely, back in school, they told you that bodies are attracted to each other with force:
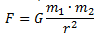
Where m 1 , m 2Are the masses of bodies, and r is the distance between them. I will disappoint you. In reality, this is usually not enough. Of course, every atom in the first body attracts every atom of the second body according to this formula. The resultant of these forces is not necessarily calculated by this formula. Bodies can have different densities, and their shape may differ from the ideal sphere. The formula is valid only if the bodies are removed from each other by a distance r >> l, where l are the linear dimensions of the bodies. If the distance to the body is comparable with its size, this method cannot be used for accurate calculations: the surface of the Earth, the value of free acceleration g is not constant and changes by a couple of percent. This problem is circumvented in several ways, which are reduced to the approximation of the mass distribution of the Earth by the model.
Earth Models
Here I will talk about the two most classic models. The first is to set the Earth as the sum of point masses, positive or negative, distributed over the surface. Usually this model is used to build the trajectory of take-off rockets, since the model gives good accuracy in the vicinity of the Earth. At high altitude, this method can give sufficient accuracy with a large number of calculations, which is considered unacceptable.
The second method is a little more complicated mathematically, but it gives good results over the entire space of heights, except for the lowest. It is based on a matan, which is called " spherical functions ", but in fact has a simple explanation. Suppose we have a function of the gravitational potential at each point in space:

Where ρ is the distance from the point of the Earth to the point we need, and P is the point of interest to us. This is a three-dimensional function of the Earth's gravity. In a first approximation, it is constant in time in latitude and longitude. It would be ideal once to precisely calculate this function and use it in the future without calculating it every time. But how to set such a function? Not an array of values! And this is where the matan comes to the rescue: why not approximate the potential function with some set of functions, some decomposition? And (oh miracle!) Such a class of functions in a matan exists and is called spherical functions. Roughly speaking, this is an analogue of the Fourier expansion for spherical coordinates. Spherical functions are orthogonal to each other and their space is full. For lovers of matan, the formula of the gravitational potential through spherical functions:
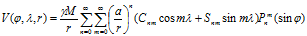
where ϕ is the latitude of the point, λ is its longitude, a is the radius of the Earth, P m n (x) is the associated Legendre function, which is determined through the Legendre polynomial as follows:
To calculate the gravitational potential at any point in space, it is enough to know the coefficients S and C. There are many works on their determination and there are many models on the Internet .
If you calculate this potential on a sphere of constant radius and expand the sphere into an image, you get something like this:
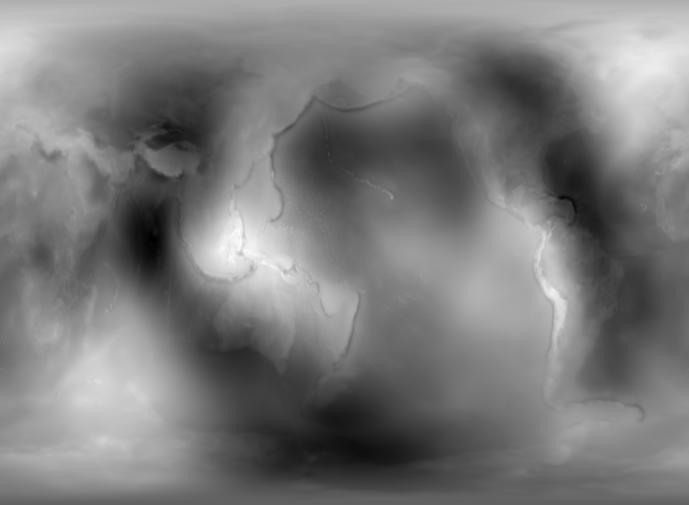
This image is for 96 harmonics of the Earth's potential. The image shows the contours of the continents and the Mariana Trench. Fun fact: when constructing models of harmonics of the Earth’s potential, data on the Earth’s gravity exploration are often not used, but satellite trajectories are analyzed. Therefore, the above image can be called a "photograph" of the Earth in the gravitational range. I rested this picture with one of my colleagues who had fun with this model, but the internet is full of other, sometimes even more complete images .
Heavenly bodies
The second most important factor in constructing the satellite motion model is the Moon. And no wonder, just look at how high the ebbs and flows it causes. But, if we roughly calculate the acceleration of the satellite’s incidence on the moon, we get only a = 3.3 ∙ 10 -6 . If this acceleration would act on a 100 kilogram satellite, then it would be able to lift just a small weight in a third of a gram of the earth. And, despite the fact that the force is so small, just one day a satellite trajectory forecast, which excludes the moon deceive a ∙ t 2 /2 ≈ 100 km.
Both the Sun and Jupiter are used in good forecasts, but their impact is much smaller than those provided by the Moon.
sunny wind

The term “solar wind” means everything that radiates our beloved sun. These are various atomic and subatomic particles and electrons and photons. On average, at the distance at which the Earth is from the Sun, the solar wind pressure is 9 ∙ 10-6 N / m2. This means that a satellite weighing 100 kilograms and an area of three square meters per day will leave about a kilometer from the calculated orbit. In principle, for real satellites, this value can be larger, since the solar wind can change the inclination of the orbit.
The indicated parameters are average parameters. During solar flares, the flow of the solar wind can change several times. Also, the fact that the closer we get to the surface of the earth is not taken into account, the greater part of the solar wind is blocked by the magnetic field and the Earth’s atmosphere.
In catalogs, usually for each satellite, the effective area is set, which can be used to calculate the pressure force of the solar wind, or a formula is given from which this coefficient can be derived.
Atmosphere
The lower the satellite flies, the stronger the atmosphere affects it. Unlike gravitational and solar wind forces, this force is dissipative and leads to the fact that over time the satellite loses energy. Long-term exposure to this force leads the satellite to descent. The formula for the force with which the atmosphere is obvious influences:
 . In the formula, p is the density of the atmosphere, s is the aerodynamic coefficient of the satellite, and v is the velocity and its module. The aerodynamic coefficient of the satellite reflects the efficiency with which the satellite brakes about the atmosphere. It is proportional to area and inversely proportional to mass. It is usually specified in satellite directories.
In short, the main forces affecting the satellites are exhausted. Of course, there are many smaller forces and features of the described forces. But their value is not great. It excites only people directly involved in specific applications.
And now let's move on to how to glue and predict all this. The simplest is the integral method. He, of course, is the most accurate, most reliable and the most ... Slow. This method is simple to disgrace. At each point, depending on the accuracy that we require, the acting forces are considered to the nth derivative, add them and approximate them to the next point. Depending on n, the method will be called the method of the nth order of accuracy. The most classic is the Runge-Kutta method , this is the 4th order method.
The second method is magic. It is known from Keppler’s laws: planets move along ellipses. Apply this to satellites. But note the following: any of the described actions does something with the ellipse along which the satellite moves. It either blows it, or unfolds, or reduces it. This means that by means of magic and fitting coefficients it is possible to transform ellipses in time. This method , depending on the accuracy and area of work, is called SGP, SGP4, SDP4, SGP8, SDP8. It is precisely because of its speed and simplicity that it has gained enormous popularity in amateur astronomy, although it is not applicable for accurate predictions.
What to get from all this and how to play with it?
You can play around simply: use programs that predict the trajectory of the satellite. And at night you can watch them. Strictly at the indicated time and place. You can do this as follows.
First of all, there are some great sites.
www.heavens-above.com - on this site you set your coordinates, after which you can immediately see all the satellites of interest: when they fly over you, what is their magnitude (for the human eye, magnitude is usually less than one-third magnitude without problems).
Also on the site you can get a complete list of "Iridium Flares", about which it was said at the beginning.
www.calsky.com- the site is less convenient than the previous one, but on it you can see the "transits" of satellites through the sun and moon. "Transit" is a span in the background. For example, like this:
Also, if you want a forecast where there is no Internet, there are a couple of offline programs. The most understandable and intuitive is the Stelarium . He will immediately draw a satellite in the sky and show the stars. You can also take advantage of specialized programs this or this .
Well, for those who like to experience everything on their own or torment themselves - there is an open source code that can do forecasting. For an analytical algorithm, the code is available here . Immediately in many languages and in many versions. I haven’t found open source code for the integral forecast, but I don’t want to give mine) If I see it, I’ll drop the link here.