How Microsoft DevDiv Uses TFS - Parts 4 and 5
- Transfer
Release planning
In previous posts, I talked about how we use TFS to implement processes.
In this, we will talk about how we planned the release.
In the Feature work item entry, we added the “Planning” tab:
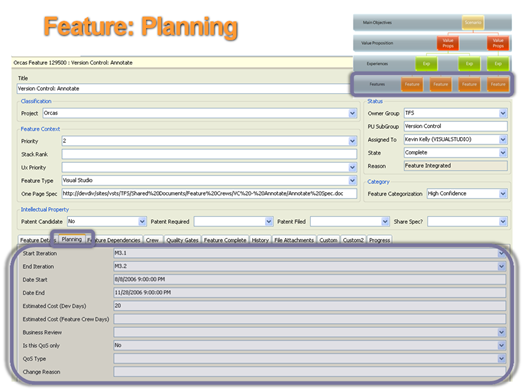
Zoom in:
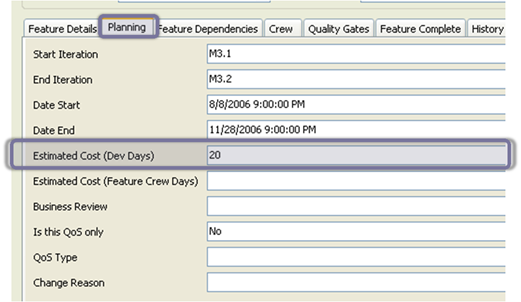
We asked people to perform an estimated cost for each functionality in the work item. Then, we moved them to the rating table, as shown below:
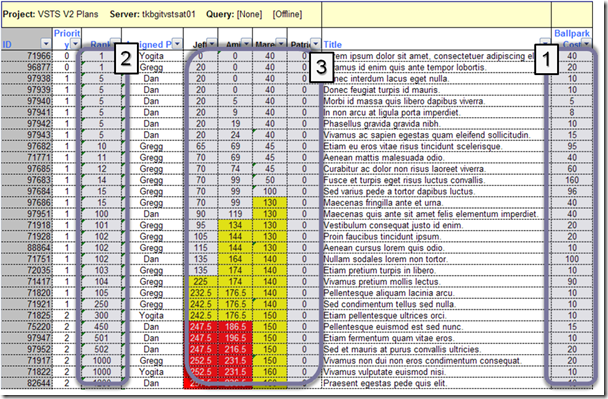
This Excel spreadsheet is directly linked to TFS. It is important to note the following:
- This estimate (like all other data) comes directly from TFS. And this is wonderful, since all estimates were entered independently of each other, but can be pulled into a single document, which makes planning easier.
- We ranged all the functionality from top to bottom.
- We added some logic to the table in order to be able to compare the total load with the team potential. Teams are highlighted in yellow if they are using their reserves by more than 70%, and red if they are using more than 100%.
This approach gives us the opportunity to quickly understand what can and what cannot be done, without the need to fuss with tables. This helped us find thin spots and plan by changing the priorities of the functionality in order to achieve a comfortable load level. For example, we moved some volumetric functionality down to allow several small functions to get into the release.
To be honest, over time, it looks like a video game. We called her the game of yellow and red, because it was fun to see how much we can reduce the yellow and red colors! :)
Next post: how we controlled the progress of work.
Gregg Boer. Link to the original .
Progress Control
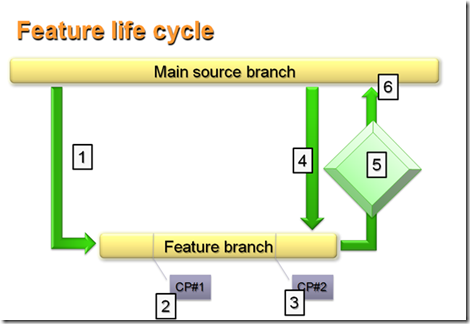
Before you start a conversation about performance monitoring, it will be useful to consider the functional life cycle that was discussed in a previous post . The image below will be the starting point for this publication.
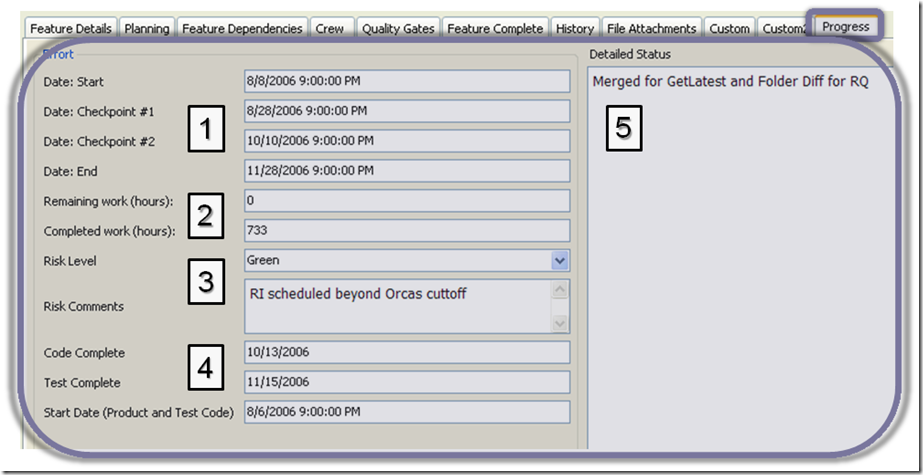
The picture below shows the tab "Progress" of the work item of the "Feature" type.
Simply put, this is my status report. As a person working on functionality, I needed to fill out such a report once a week. There was no need to use e-mail or create documents, I just updated the fields in this section.
When the Developer Division decided to implement the model of the functional development team, as well as all the qualitative characteristics (in the original, Quality Gates), we decided not to interfere with the management processes that the functional development teams took for themselves.
Some used the “waterfall” method with MS Project, others used SCRUM, some used Excel or glued stickers, and some simply painted on the board. It really didn't make any difference to the unit as a whole, as long as you update the information in the section shown above.
The Progress bookmark has become the unit’s standard for providing the minimum set of information needed for weekly communication.
Looking at this bookmark, you might think that this is too primitive and simple game. However, the fact is that this has become a very useful reporting tool. And this will be discussed in detail in subsequent publications.
Let's take a closer look at all the elements from this figure.
- Key Dates - we tracked four key dates: the beginning and end of work on the functionality and two intermediate key dates. IMPORTANT NOTE: before starting the implementation of the functional, the team had to fix the key date No. 1 and evaluate the onset of the key date No. 2, as well as the end date of this work. When the key date No. 1 arrives, the team fixes the key date No. 2 and estimates the completion date. It seems to me that this model worked well.
- Percentage complete - just the expected and finished work on all the functionality. Since we did not intervene in the management processes within the teams, we demanded that they clearly understand how much was done and how much was to be done.
- Risk Level - the first field, like a classic traffic light, in the risk indicator. Green = we meet deadlines, Yellow = there is a risk of missed deadlines, Red = we missed the deadlines. The second field contains text comments.
- Additional important dates.
- Text notes on the status of the work.
In the next publication, I will show you how we used the information described above to control the simultaneous implementation of multiple functionalities, as well as the lessons that we learned.