Having fun with z-index
- Transfer
 Elements on web pages are mainly located side by side or under each other. But sometimes design requires overlapping elements. For example, a drop-down navigation menu, hover preview panels, useless cookie banners and, of course, countless pop-ups requiring your immediate attention.
 In these situations, the browser must somehow decide which elements to show "from above" and which elements to keep in the background, fully or partially closed. The relatively complex set of rules in the CSS standard defines the default blending order for each page element (probably everything in the world can be called “relatively complex”, but it’s immediately alarming that the standard comes with a special application entitled“Detailed Description of Overlay Contexts” ).
If the default order does not suit, then the developers resort to the property
z-index: it gives control over the virtual axis z (depth), which conceptually passes through the page. Thus, an element with a higher one is z-indexdisplayed “closer” to the user, that is, it is drawn on top of elements with lower indices. An interesting property of the axis
zlies in the fact that it has no natural boundaries. The horizontal and vertical axes are usually limited by the expected size of the display. We do not expect any items to be pushed to “1,000,000px on the left” or “-3000em on the top”: they will either become invisible or cause an unpleasant scroll. (Unless you are reading this article at a time when displays are millions of pixels wide. If so, I urge you to stop reading and start a trillion-dollar web page project). But the values
z-indexare dimensionless and only matter in relative terms: a page with two elements will look the same if the indices zare equal 1and 2or −10and999. Combined with the fact that pages are often assembled from components designed in isolation, this leads to the curious art of selecting the appropriate z-indexes. How to ensure that your annoying pop-up appears exactly on top of all the elements on the page if you don't know how many there are, who wrote them, and how much they wanted to be at the top? That's when you put your z-index at 100, or maybe 999, or maybe just in case, at 99999 to ensure that yours will definitely win.
At least that's how I write my CSS. In the rest of this post, we'll look at millions of z-indices and see what other web developers are doing.
Data retrieval
The first step was to collect a large set of z-index values from existing web pages. To do this, I turned to Common Crawl , a public, very large and wonderful repository of pages from the Internet. Data is hosted on S3, so you can request it quite efficiently from an AWS cluster. Fortunately, there are several tutorials on the Internet that show how to do this.
My sophisticated z-index extractor involves searching on every page for all matches of the following regular expression:
re.compile(b'z-index *: *(-?[0-9]+|auto|inherit|initial|unset)')Once the values are determined, the standard map-reduce task remains for the number of occurrences. Fortunately, I'm not the first one who wanted to count the occurrences of all sorts of things in the sample, and this was enough to adapt one of many examples . (Almost all of my personal code is a regular expression at the top).
Thanks to a very detailed blog article, I was able to deploy the code to the Elastic Map Reduce cluster , and I started scanning the page archive for March 2019.. This particular archive is divided into 56,000 parts, of which I randomly selected 2,500, or about 4.4%. This number is nothing special, except that it roughly translates into the price that I was ready to invest in this experiment. After a terrible night in the hope that I did not make the forecasts correctly, I got results extracted from 112.7 million pages. (I have to point out that these are all HTML pages. I haven’t delved into this question too much, but Common Crawl doesn't seem to index external stylesheets, and as a result I only extract values from inline CSS. I’ll leave it as an exercise for the reader to determine whether the resulting distribution matches what you get from external style sheets).
The most common values
My scan yielded a total of about 176.5 million z-index values, of which 36.2 thousand are unique.
So what are the most common?
The figure shows the top 50. Note that the y axis is logarithmic and shows relative frequencies. For example, the most common value of 1 is 14.6% of all occurrences found in the sample. In general, the top 50 is about all 80% of the collected values.

The first observation is that positive values dominate. The only negative element in the top 50 is
−1(the second most common −2is 70th). Perhaps this tells us that people are usually more interested in taking things upstairs than hiding them in the background.Typically, most top values have one of the following properties:
- They are small: for example, all numbers from 0 to 12 are in the top 50.
- These are degrees of ten or multiple numbers: 10, 100, 1000, 2000, ...
- They are “close” to the power of ten: 1001, 999, 10001, ...
These patterns are consistent with the fact that people choose large "familiar" values (degrees of ten), and then, perhaps, to adjust the relative depth inside the component - values are slightly higher or lower.
It is also interesting to look at the most common values that do not fit into any of these patterns:
At 36th place, we see 2147483647. Many programmers immediately recognize this number as
INT_MAX, that is, 2 31 −1. People probably argue like this: since this is the largest value for a (signed) integer, no z-index will be higher, so my element with the index INT_MAX will always be at the top. However, MDN says the following about integers in CSS:There is no official range of type values Thus, not only is there no agreed maximum value, but in every documented specification or standard offer
INT_MAXit is actually out of range. On the 39th place we have 8675309, in which I personally did not see anything remarkable. But for more than half a million developers, obviously, it makes sense. I suspect that you either instantly recognize this number, or you don’t understand its meaning at all, depending on where and when you grew up. I will not give out spoilers, the answer is hidden behind just one search .
The last two numbers, which seemed a little inappropriate, are 1030 and 1050, at 42nd and 45th places, respectively. Another cursory search showed that these are the default z-index values for classes
navbar-fixedandmodal in bootstrap.Distribution of values
Although the vast majority of all values
z-indexcome from a small number of options, it may be interesting to look at the wider distribution of the assembled set. For example, Figure 2 shows the frequency of all values between -120 and 260. 
In addition to the dominance of round numbers, we see an almost fractal quality of patterns at several levels. For example, the middle between two local maxima is often itself a (smaller) local maximum: it is 5 between 1 and 10, 15 between 10 and 20, 50 between 1 and 100, etc.
We can confirm this effect on a wider range: the following figure shows the frequencies of all values from -1200 to 2600, with rounding to a smaller modulus to ten, that is, numbers like 356 and 359 were counted as 350. The graph is very similar to the previous one. As you can see, the structure is mainly preserved when considering values an order of magnitude larger.

Finally, in the last illustration, all positive values
z-indexfrom 1 to 9999999999 are grouped by the first digit (horizontal axis) and the number of digits (vertical axis). 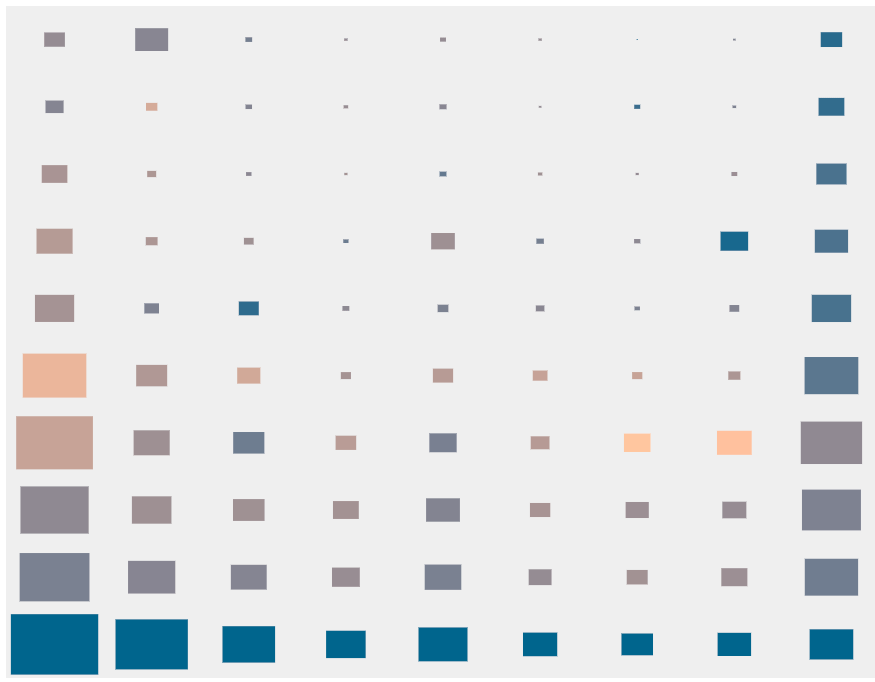
Positive values
z-indexgrouped by first digit and number of digits. Dimensions are proportional to the overall frequency of the group. Click on a group for more information.We can intuitively present each group as a template of values, for example,
3xxxfor all four-digit values starting with 3. Each group is displayed as a rectangle, the size of which is proportional to the frequency of the pattern. The figure shows, for example, that for each order of magnitude, that is, a number of groups, the frequencies follow a similar trend, and the values starting from 1 are the most common, then 9, then 5. The hue of each group is established based on its entropy. Yellow groups have the highest entropy, while blue groups have the lowest. This helps to highlight patterns where developers tend to choose the same values, or those where the values are distributed more evenly (note that the entropy of our entire data set is 6.51 bits).
Conclusion
Although it was definitely interesting to collect and explore this data set, I am sure that there are better statistics, visualizations and explanations awaiting production and presentation. If you want to try, feel free to download and distribute the z-index-data.csv file .
Perhaps you will succeed where I failed, and find a way to include in the graph the highest value
z-indexthat I found, namely 10 1242 -1. Yes, the number 9 is repeated 1242 times. I really hope that they were finally able to show their
upstairs.