Count the agents "Examiner"
It is no secret that the “Inspector” automated system monitors the control of locks on the list of banned information in Russia. How it works is well written here in this article on Habr , the picture is from the same place:
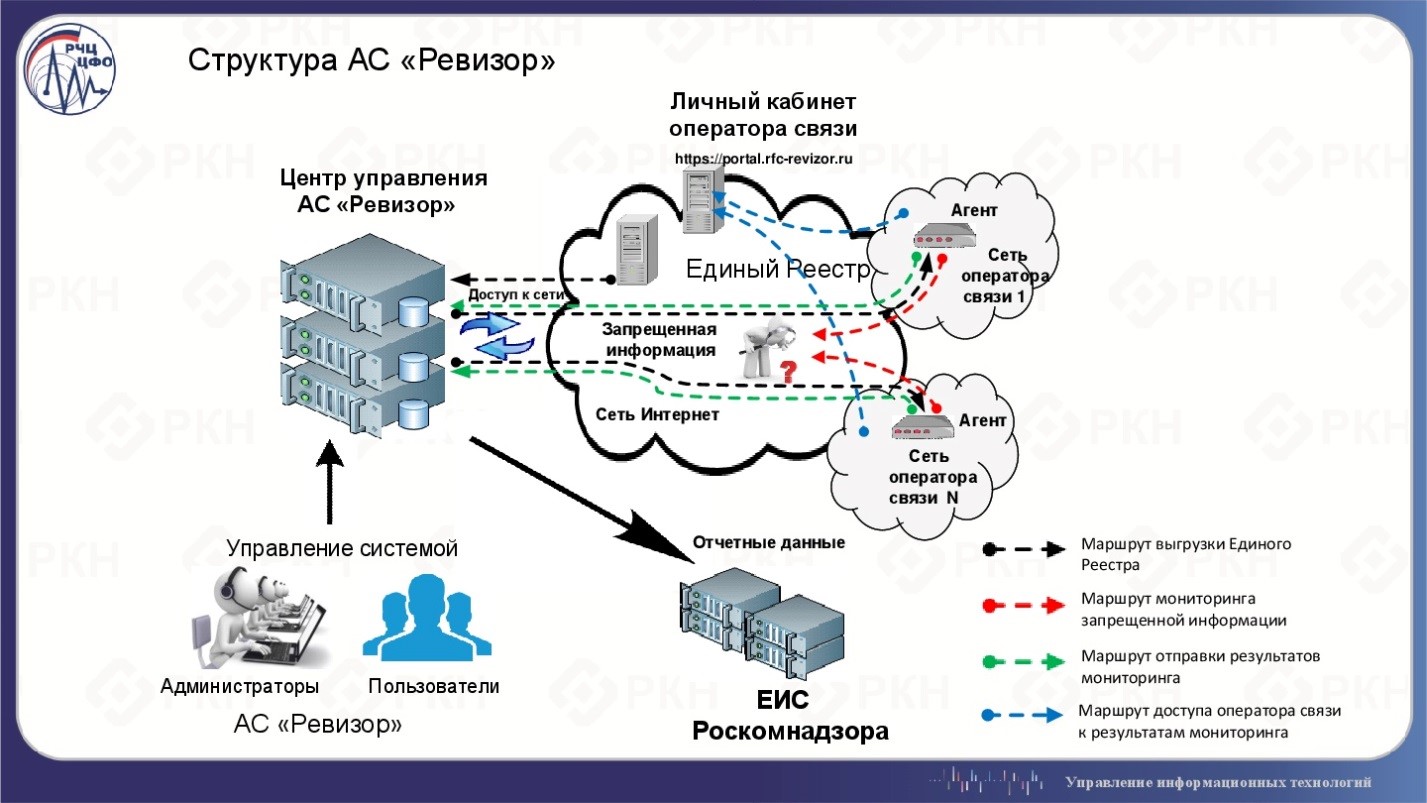
The Agent Inspector module is installed directly at the provider :
Given that, if not all, then many providers installed this device at home, they should have got a large network of beacon probes like RIPE Atlas and even more, but with closed access. However, the lighthouse is the lighthouse to send signals in all directions, but what if we catch them and see what we caught and how many?
Before counting, let's see why this may even be possible.
Agents check the availability of a resource, including through HTTP (S) requests, such as this example:
Request addition payload is more of a connection setup phase: exchange
The forbidden information registry contains several types of locks. Obviously, if the resource is blocked by IP address or domain name, then we will not see any requests. These are the most destructive types of locks that lead to the inaccessibility of all resources on the same IP address or all information on the domain. There is also a URL blocking type. In this case, the filtering system should parse the HTTP request header to determine exactly what to block. And before it, as can be seen above, the connection setup phase should happen, which you can try to track, since most likely the filter will skip it.
To do this, you need to choose a suitable free domain with the type of blocking "by URL" and HTTP, in order to facilitate the work of the filtering system, preferably long abandoned, to minimize the ingress of extraneous traffic except from Agents. This task was not at all difficult, there are a lot of free domains in the registry of prohibited information for every taste. Therefore, the domain was purchased, tied to IP addresses on the VPS with the running
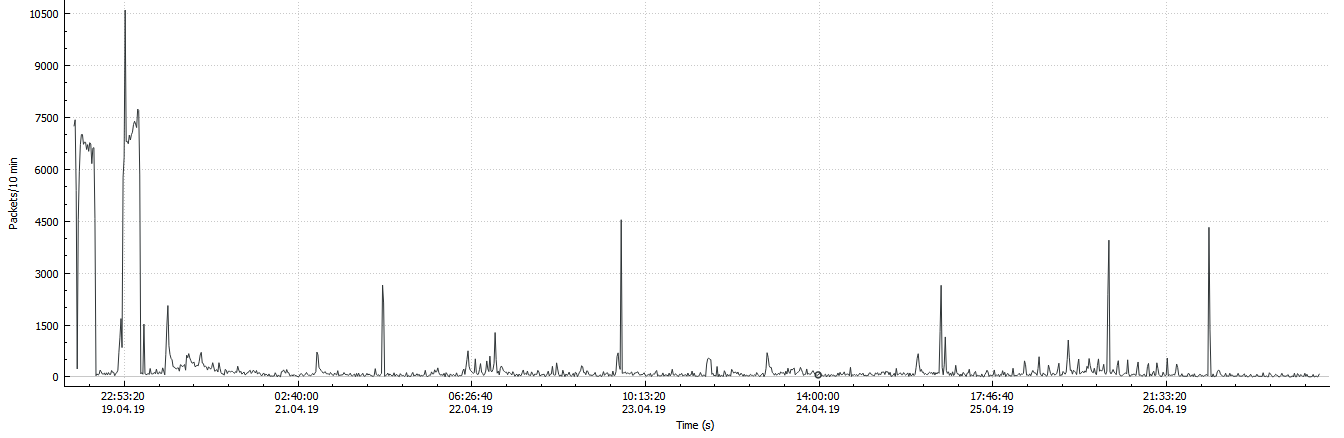
I expected to see periodic bursts of requests, which in my opinion would indicate a controlled action. This is not to say that I didn’t see this at all, but there was definitely no clear picture: Unsurprisingly, even an unnecessary domain for an unused IP will simply receive a lot of unsolicited information, such is the modern Internet. But fortunately, I needed only requests for a specific URL, so all the crawlers and password brutes were quickly found. Also, it was simple enough to understand where the flood was by the mass of the same type of requests. Then I compiled the frequency of occurrence of IP addresses and walked around the top manually separating those who slipped in the previous steps. Additionally, I cut out all the sources that sent one packet, there were not many of them. And it turned out this:
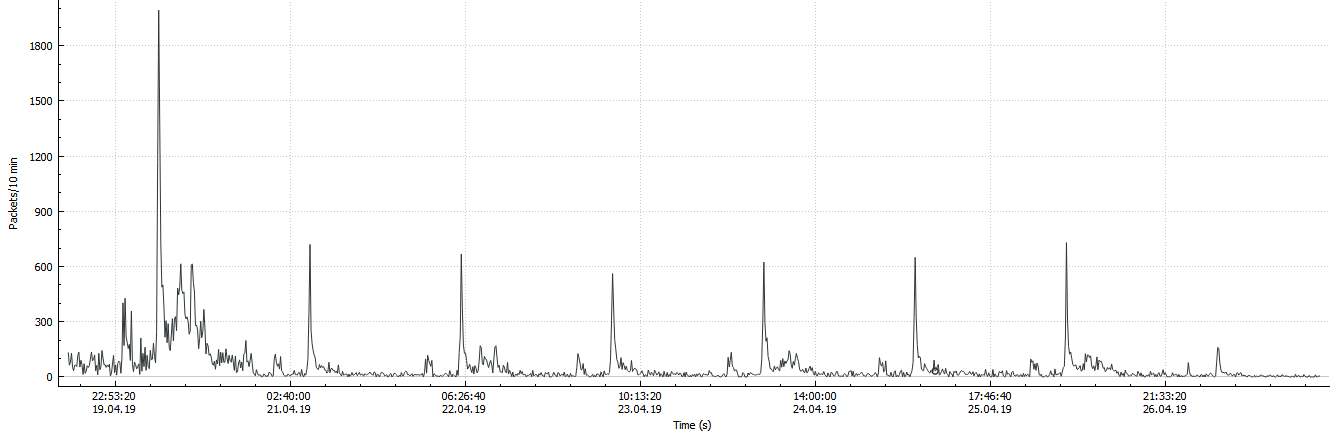
A slight lyrical digression. A little more than a day later, my hosting provider sent a rather streamlined message, they say that at your facilities there is a resource from the prohibited list of ILV so it is blocked. At first I thought that they blocked my account, it was not so. Then I thought that they were just warning me about what I already knew about. But it turned out that the hoster turned on its filter in front of my domain and as a result, I came under double filtering: from the providers and the host. The filter skipped only the ends of requests:
Get to the point. In my opinion, two bursts are clearly visible every day, the first less after midnight in Moscow, the second closer to 6 in the morning with a tail up to 12 days. The peak does not occur exactly at the same time. First, I wanted to highlight IP addresses that fell only in these periods and each in all periods, based on the assumption that the Agents check periodically. But upon careful viewing, I quickly discovered periods falling into other intervals, with different frequencies, up to one request every hour. Then I thought about time zones and what is possible in them, then I thought that in general the system may not be synchronized globally. In addition, for sure, NAT will play its role, and the same Agent can make requests from different public IPs.
Since my original goal was not exactly, I counted all the addresses that I got in a week and got 2791 . The number of TCP sessions established from one address is on average 4, with a median of 2. Top sessions per address: 464, 231, 149, 83, 77. The maximum of 95% of the sample is 8 sessions per address. The median is not very high, I recall that the schedule shows a clear daily frequency, so you could expect something around 4 to 8 in 7 days. If you throw out all the meeting sessions once, then we just get the median equal to 5. But I could not exclude them on a clear basis. On the contrary, spot checks showed that they are related to requests of a prohibited resource.
Addresses, and on the Internet more important autonomous systems - AS, which turned out 1510, on average, 2 addresses on the AS with a median of 1. Top addresses on the AS: 288, 77, 66, 39, 27. The maximum of 95% of the sample is 4 addresses on the AS. Here the median is expected - one Agent per provider. We also expect the top - there are large players in it. In a large network, Agents should probably be in each region of the operator’s presence, and do not forget about NAT. If you take by country, the maximums will be: 1409 - RU, 42 - UA, 23 - CZ, 36 from other regions, not RIPE NCC. Requests not from Russia attract attention. Perhaps this can be explained by geolocation errors or registrar errors when filling in the data. Or the fact that a Russian company may have non-Russian roots, or have a foreign representative office because it is so simpler that it is natural to deal with a foreign organization RIPE NCC. Some part is undoubtedly superfluous, but it’s reliably difficult to separate it, since the resource is under a lock, and from the second day under a double lock, most sessions are just an exchange of several service packets. Let's agree on the fact that this is a small part.
These numbers can already be compared with the number of providers in Russia. According to the ILV, the licenses for “Communication services for data transmission, except for voice” are 6387, but this is a highly bullied rating from above, not all of these licenses are specifically for Internet providers that need to install the Agent. In the RIPE NCC zone, a similar number of AS registered in Russia is 6230, of which not all providers. UserSide did a tighter countand received 3940 companies in 2017, and it’s rather an upper estimate. In any case, we have the number of illuminated AS two and a half times less. But here it is worthwhile to understand that AS is not strictly equal to the provider. Some providers do not have their own AS, some have more than one. If we assume that the Agents still stand at everyone, then someone filters more than the others, so their requests are indistinguishable from the garbage, if at all. But for a rough assessment it is quite tolerable, even if something was lost due to my oversight.
Despite the fact that my hosting provider has enabled its filter since the second day, according to the information for the first day, we can conclude that the locks work successfully. Only 4 sources were able to break through and have completely finished HTTP and TCP sessions (as in the example above). Another 460 can be sent
Variations of this can be different: fewer
From the rest you can’t even see
Or so:
The difference is surely visible
Or so:
And all this repeats and repeats and repeats, as can be seen on the graph, exactly more than once, every day.
The good news is he is. I can reliably say that from 5 different IPv6 addresses there are periodic requests to the forbidden resource, exactly the behavior of the Agents that I expected. Moreover, one of the IPv6 addresses does not fall under the filtering and I see a full session. With two more, I saw only one incomplete session, one of which was interrupted by
Since there are few addresses, I studied all of them in detail and it turned out that there are only 3 providers in there, you can applaud them standing up! Another address is cloud hosting in Russia (does not filter), another is a research center in Germany (there is a filter, where?). But why do they check on schedule the availability of prohibited resources is a good question. The remaining two made one request and are not in the borders of Russia, with one of them being filtered (is it still in transit?).
Locks and Agents is a big brake on IPv6, the implementation of which is therefore not moving very fast. It is sad. Those who have solved this task are fully proud of themselves.
I did not pursue 100% accuracy, I ask you to forgive me for this, I hope someone wants to repeat this work with greater accuracy. It was important for me to understand whether such an approach would work in principle. The answer will be. The resulting figures in a first approximation, I think, are quite reliable.
What else could be done and what I was too lazy to do was to calculate DNS queries. They are not filtered, but also do not give much accuracy since they work only for the domain, and not for the entire URL. Frequency should be visible. If you combine with what is directly visible in the requests, this will allow you to separate the excess and get more information. It’s even possible to identify the DNS developers used by providers and much more.
I absolutely did not expect that for my VPS the hoster will also include its own filter. Maybe this is a common practice. In the end, the ILV sends a request to delete the resource to the hoster. But it didn’t surprise me and even played to some advantage. The filter worked very efficiently cutting off all the correct HTTP requests to the forbidden URL, but not the correct ones that passed through the filter of the providers before, even if in the form of endings:
In the beginning, I compared the AC “Auditor” with RIPE Atlas . This comparison is justified and a large network of Agents can be beneficial. For example, determining the quality of resource availability from various providers in different parts of the country. You can calculate the delays, you can build graphs, you can analyze everything and see the changes occurring both locally and globally. This is not the most direct way, but astronomers use "standard candles", why not use Agents? Knowing (finding) their standard behavior, you can determine the changes that occur around them and how this affects the quality of the services provided. And at the same time, you do not need to independently install probes on the network, they have already been supplied by Roskomnadzor.
Another point that I want to touch on is that every tool can be a weapon. AS “Inspector” is a closed network, but Agents surrender everyone with giblets by sending requests for all resources from the forbidden list. To get hold of such a resource does not represent absolutely any problems. Altogether, providers through Agents, unwillingly telling about their network much more than would be worth it: types of DPI and DNS, location of the Agent (central node and service network?), Network markers of delays and losses - and this is only the most obvious. Just as someone can monitor the actions of Agents to improve the availability of their resources, someone can do this for other purposes and there are no obstacles. A double-edged and very multifaceted instrument turned out, anyone can be convinced of this.
The Agent Inspector module is installed directly at the provider :
The “Agent Auditor” module is a structural element of the automated system “Auditor” (AS “Auditor”). This system is designed to monitor the compliance by telecom operators with restrictions on access within the framework of the provisions established by Articles 15.1-15.4 of the Federal Law of July 27, 2006 No. 149-ФЗ “On Information, Information Technologies and Information Protection”.
The main goal of creating the Auditor AS is to monitor compliance by telecom operators with the requirements established by Articles 15.1-15.4 of the Federal Law of July 27, 2006 No. 149-ФЗ “On Information, Information Technologies and Information Protection” regarding the identification of facts of access to prohibited information and obtaining supporting materials (data) on violations to restrict access to prohibited information.
Given that, if not all, then many providers installed this device at home, they should have got a large network of beacon probes like RIPE Atlas and even more, but with closed access. However, the lighthouse is the lighthouse to send signals in all directions, but what if we catch them and see what we caught and how many?
Before counting, let's see why this may even be possible.
Bit of theory
Agents check the availability of a resource, including through HTTP (S) requests, such as this example:
TCP, 14678  >  80, "[SYN] Seq=0"
TCP, 80  >  14678, "[SYN, ACK] Seq=0 Ack=1"
TCP, 14678  >  80, "[ACK] Seq=1 Ack=1"
HTTP, "GET /somepage HTTP/1.1"
TCP, 80  >  14678, "[ACK] Seq=1 Ack=71"
HTTP, "HTTP/1.1 302 Found"
TCP, 14678  >  80, "[FIN, ACK] Seq=71 Ack=479"
TCP, 80  >  14678, "[FIN, ACK] Seq=479 Ack=72"
TCP, 14678  >  80, "[ACK] Seq=72 Ack=480"
Request addition payload is more of a connection setup phase: exchange
SYNand SYN-ACK, and complete the connection phase: FIN-ACK. The forbidden information registry contains several types of locks. Obviously, if the resource is blocked by IP address or domain name, then we will not see any requests. These are the most destructive types of locks that lead to the inaccessibility of all resources on the same IP address or all information on the domain. There is also a URL blocking type. In this case, the filtering system should parse the HTTP request header to determine exactly what to block. And before it, as can be seen above, the connection setup phase should happen, which you can try to track, since most likely the filter will skip it.
To do this, you need to choose a suitable free domain with the type of blocking "by URL" and HTTP, in order to facilitate the work of the filtering system, preferably long abandoned, to minimize the ingress of extraneous traffic except from Agents. This task was not at all difficult, there are a lot of free domains in the registry of prohibited information for every taste. Therefore, the domain was purchased, tied to IP addresses on the VPS with the running
tcpdumpand the counting started.Audit of the “Auditors”
I expected to see periodic bursts of requests, which in my opinion would indicate a controlled action. This is not to say that I didn’t see this at all, but there was definitely no clear picture: Unsurprisingly, even an unnecessary domain for an unused IP will simply receive a lot of unsolicited information, such is the modern Internet. But fortunately, I needed only requests for a specific URL, so all the crawlers and password brutes were quickly found. Also, it was simple enough to understand where the flood was by the mass of the same type of requests. Then I compiled the frequency of occurrence of IP addresses and walked around the top manually separating those who slipped in the previous steps. Additionally, I cut out all the sources that sent one packet, there were not many of them. And it turned out this:
A slight lyrical digression. A little more than a day later, my hosting provider sent a rather streamlined message, they say that at your facilities there is a resource from the prohibited list of ILV so it is blocked. At first I thought that they blocked my account, it was not so. Then I thought that they were just warning me about what I already knew about. But it turned out that the hoster turned on its filter in front of my domain and as a result, I came under double filtering: from the providers and the host. The filter skipped only the ends of requests:
FIN-ACKand RSTcutting off all HTTP at the forbidden URL. As you can see from the graph above, after the first day I began to receive less data, but I still received them, which was quite enough for the task of calculating query sources.Get to the point. In my opinion, two bursts are clearly visible every day, the first less after midnight in Moscow, the second closer to 6 in the morning with a tail up to 12 days. The peak does not occur exactly at the same time. First, I wanted to highlight IP addresses that fell only in these periods and each in all periods, based on the assumption that the Agents check periodically. But upon careful viewing, I quickly discovered periods falling into other intervals, with different frequencies, up to one request every hour. Then I thought about time zones and what is possible in them, then I thought that in general the system may not be synchronized globally. In addition, for sure, NAT will play its role, and the same Agent can make requests from different public IPs.
Since my original goal was not exactly, I counted all the addresses that I got in a week and got 2791 . The number of TCP sessions established from one address is on average 4, with a median of 2. Top sessions per address: 464, 231, 149, 83, 77. The maximum of 95% of the sample is 8 sessions per address. The median is not very high, I recall that the schedule shows a clear daily frequency, so you could expect something around 4 to 8 in 7 days. If you throw out all the meeting sessions once, then we just get the median equal to 5. But I could not exclude them on a clear basis. On the contrary, spot checks showed that they are related to requests of a prohibited resource.
Addresses, and on the Internet more important autonomous systems - AS, which turned out 1510, on average, 2 addresses on the AS with a median of 1. Top addresses on the AS: 288, 77, 66, 39, 27. The maximum of 95% of the sample is 4 addresses on the AS. Here the median is expected - one Agent per provider. We also expect the top - there are large players in it. In a large network, Agents should probably be in each region of the operator’s presence, and do not forget about NAT. If you take by country, the maximums will be: 1409 - RU, 42 - UA, 23 - CZ, 36 from other regions, not RIPE NCC. Requests not from Russia attract attention. Perhaps this can be explained by geolocation errors or registrar errors when filling in the data. Or the fact that a Russian company may have non-Russian roots, or have a foreign representative office because it is so simpler that it is natural to deal with a foreign organization RIPE NCC. Some part is undoubtedly superfluous, but it’s reliably difficult to separate it, since the resource is under a lock, and from the second day under a double lock, most sessions are just an exchange of several service packets. Let's agree on the fact that this is a small part.
These numbers can already be compared with the number of providers in Russia. According to the ILV, the licenses for “Communication services for data transmission, except for voice” are 6387, but this is a highly bullied rating from above, not all of these licenses are specifically for Internet providers that need to install the Agent. In the RIPE NCC zone, a similar number of AS registered in Russia is 6230, of which not all providers. UserSide did a tighter countand received 3940 companies in 2017, and it’s rather an upper estimate. In any case, we have the number of illuminated AS two and a half times less. But here it is worthwhile to understand that AS is not strictly equal to the provider. Some providers do not have their own AS, some have more than one. If we assume that the Agents still stand at everyone, then someone filters more than the others, so their requests are indistinguishable from the garbage, if at all. But for a rough assessment it is quite tolerable, even if something was lost due to my oversight.
About DPI
Despite the fact that my hosting provider has enabled its filter since the second day, according to the information for the first day, we can conclude that the locks work successfully. Only 4 sources were able to break through and have completely finished HTTP and TCP sessions (as in the example above). Another 460 can be sent
GET, but the session instantly breaks off RST. Pay attention to TTL:TTL 50, TCP, 14678 > 80, "[SYN] Seq=0"
TTL 64, TCP, 80 > 14678, "[SYN, ACK] Seq=0 Ack=1"
TTL 50, TCP, 14678 > 80, "[ACK] Seq=1 Ack=1"
HTTP, "GET /filteredpage HTTP/1.1"
TTL 64, TCP, 80 > 14678, "[ACK] Seq=1 Ack=294"
#Вот это прислал фильтр
TTL 53, TCP, 14678 > 80, "[RST] Seq=3458729893"
TTL 53, TCP, 14678 > 80, "[RST] Seq=3458729893"
HTTP, "HTTP/1.1 302 Found"
#А это попытка исходного узла получить потерю
TTL 50, TCP ACKed unseen segment, 14678 > 80, "[ACK] Seq=294 Ack=145"
TTL 50, TCP, 14678 > 80, "[FIN, ACK] Seq=294 Ack=145"
TTL 64, TCP, 80 > 14678, "[FIN, ACK] Seq=171 Ack=295"
TTL 50, TCP Dup ACK 14678 > 80 "[ACK] Seq=295 Ack=145"
#Исходный узел понимает что сессия разрушена
TTL 50, TCP, 14678 > 80, "[RST] Seq=294"
TTL 50, TCP, 14678 > 80, "[RST] Seq=295"
Variations of this can be different: fewer
RSTor more retransmissions - it also depends on what the filter sends to the source node. In any case, this is the most reliable template, from which it is clear that the forbidden resource was requested. Plus, there is always an answer that appears in a session with TTLmore than in previous and subsequent packages. From the rest you can’t even see
GET:TTL 50, TCP, 14678 > 80, "[SYN] Seq=0"
TTL 64, TCP, 80 > 14678, "[SYN, ACK] Seq=0 Ack=1"
#Вот это прислал фильтр
TTL 53, TCP, 14678 > 80, "[RST] Seq=1"
Or so:
TTL 50, TCP, 14678  >  80, "[SYN] Seq=0"
TTL 64, TCP, 80  >  14678, "[SYN, ACK] Seq=0 Ack=1"
TTL 50, TCP, 14678  >  80, "[ACK] Seq=1 Ack=1"
#Вот это прислал фильтр
TTL 53, TCP, 14678  >  80, "[RST, PSH] Seq=1"
TTL 50, TCP ACKed unseen segment, 14678 > 80, "[FIN, ACK] Seq=89 Ack=172"
TTL 50, TCP ACKed unseen segment, 14678 > 80, "[FIN, ACK] Seq=89 Ack=172"
#Опять фильтр, много раз
TTL 53, TCP, 14678  >  80, "[RST, PSH] Seq=1"
...
The difference is surely visible
TTLif something flies from the filter. But often it may not fly at all:TCP, 14678 > 80, "[SYN] Seq=0"
TCP, 80 > 14678, "[SYN, ACK] Seq=0 Ack=1"
TCP Retransmission, 80 > 14678, "[SYN, ACK] Seq=0 Ack=1"
...
Or so:
TCP, 14678  >  80, "[SYN] Seq=0"
TCP, 80  >  14678, "[SYN, ACK] Seq=0 Ack=1"
TCP, 14678  >  80, "[ACK] Seq=1 Ack=1"
#Прошло несколько секунд без трафика
TCP, 80  >  14678, "[FIN, ACK] Seq=1 Ack=1"
TCP Retransmission, 80 > 14678, "[FIN, ACK] Seq=1 Ack=1"
...
And all this repeats and repeats and repeats, as can be seen on the graph, exactly more than once, every day.
About IPv6
The good news is he is. I can reliably say that from 5 different IPv6 addresses there are periodic requests to the forbidden resource, exactly the behavior of the Agents that I expected. Moreover, one of the IPv6 addresses does not fall under the filtering and I see a full session. With two more, I saw only one incomplete session, one of which was interrupted by
RSTthe filter, the second by time. A total of 7 .Since there are few addresses, I studied all of them in detail and it turned out that there are only 3 providers in there, you can applaud them standing up! Another address is cloud hosting in Russia (does not filter), another is a research center in Germany (there is a filter, where?). But why do they check on schedule the availability of prohibited resources is a good question. The remaining two made one request and are not in the borders of Russia, with one of them being filtered (is it still in transit?).
Locks and Agents is a big brake on IPv6, the implementation of which is therefore not moving very fast. It is sad. Those who have solved this task are fully proud of themselves.
Finally
I did not pursue 100% accuracy, I ask you to forgive me for this, I hope someone wants to repeat this work with greater accuracy. It was important for me to understand whether such an approach would work in principle. The answer will be. The resulting figures in a first approximation, I think, are quite reliable.
What else could be done and what I was too lazy to do was to calculate DNS queries. They are not filtered, but also do not give much accuracy since they work only for the domain, and not for the entire URL. Frequency should be visible. If you combine with what is directly visible in the requests, this will allow you to separate the excess and get more information. It’s even possible to identify the DNS developers used by providers and much more.
I absolutely did not expect that for my VPS the hoster will also include its own filter. Maybe this is a common practice. In the end, the ILV sends a request to delete the resource to the hoster. But it didn’t surprise me and even played to some advantage. The filter worked very efficiently cutting off all the correct HTTP requests to the forbidden URL, but not the correct ones that passed through the filter of the providers before, even if in the form of endings:
FIN-ACKand RST- minus minus and almost got a plus. By the way, the IPv6 hoster was not filtered. Of course, this affected the quality of the collected material, but still made it possible to see the frequency. This turned out to be an important point when choosing a site for placing resources, do not forget to be interested in the issue of organizing work with the list of prohibited sites and inquiries from the ILV.In the beginning, I compared the AC “Auditor” with RIPE Atlas . This comparison is justified and a large network of Agents can be beneficial. For example, determining the quality of resource availability from various providers in different parts of the country. You can calculate the delays, you can build graphs, you can analyze everything and see the changes occurring both locally and globally. This is not the most direct way, but astronomers use "standard candles", why not use Agents? Knowing (finding) their standard behavior, you can determine the changes that occur around them and how this affects the quality of the services provided. And at the same time, you do not need to independently install probes on the network, they have already been supplied by Roskomnadzor.
Another point that I want to touch on is that every tool can be a weapon. AS “Inspector” is a closed network, but Agents surrender everyone with giblets by sending requests for all resources from the forbidden list. To get hold of such a resource does not represent absolutely any problems. Altogether, providers through Agents, unwillingly telling about their network much more than would be worth it: types of DPI and DNS, location of the Agent (central node and service network?), Network markers of delays and losses - and this is only the most obvious. Just as someone can monitor the actions of Agents to improve the availability of their resources, someone can do this for other purposes and there are no obstacles. A double-edged and very multifaceted instrument turned out, anyone can be convinced of this.