On decomposition of the multi-channel response of a system into “pseudo-proprietary” modes of vibration
Pasted by dozens of sensors, the “research object" during full-scale dynamic tests (for example, when studying the vehicle’s vibrational activity) easily provides us with a large amount of data, but it’s often not very clear what to do with it. The same thing is with simulation modeling of dynamic processes of systems with a large number of degrees of freedom.
This may not be completely clear to those who do not encounter a problem regularly, but - looking at the corresponding animation of a process stochastic in time and space, as a rule, is almost pointless. Where it breaks or why it shakes like that - usually “not visible”. What they came up with besides animation, I’ll tell you below, but I’ll recommend this.
By means of an elementary procedure, one can also obtain the spatial “forms” of the oscillations themselves, moreover, it is precisely the actual manifestations under given loading conditions and the intensity of their manifestation (dispersion; if desired, the processes themselves).
Fig. 1 Decomposition of a multi-channel response into pseudo-forms. “String in a viscous medium” (see fig. 2)
In addition to animation, “pairwise” studies (mutual spectra, etc.) are known which, of course, do not give a general picture.
Such methods are quite obvious - by “cutting out” very narrow bands of the spectrum corresponding to resonant peaks in the spectrograms, spectrogram (again “pairwise”) methods produce almost-forms of almost-harmonic (highly correlated) vibrations.
In addition to the obvious technical complexity, the disadvantage of such methods is that you usually need to "successfully" choose a "reference" channel, which is not always possible. As a result, very large errors occur in the mutual phases of the processes. In addition, the distinguished spatial form of oscillations and without such errors, due to the properties of a linear system, can turn out to be “complex” (non-phase), which its value for subsequent subjective analysis usually (not always) significantly reduces.
A 4-channel study of torsional vibrations (the carrier system of an average bus) is known, which is allocated in one process using the spatial vibrational shape determined by the researcher’s inspiration - the readings of two sensors located diagonally at the corners of the body were added (taken from “+”), from they were subtracted (taken from “-”) the testimony of two others located axisymmetrically.
Even with a small number of sensors, this approach may not be entirely good. For example, a truck’s frame is usually much more malleable in the sub-engine (front) part, respectively, a torsional shape, perhaps it should be assumed in a more complex form (probably with some “increasing” coefficients for the front sensors - and at the same time, the question of substantiating the accepted models). With a larger number of surveillance channels, all this is very complicated and poorly justified.
The explicit separation (into separate processes) of several forms of vibrations (modes), previously determined from another experiment or modeling, was once proposed by me (probably not only by me) and was called by my chief then “the method of modal decomposition”. It was supposed to analyze the results of field tests in such a way, and to determine the vectors of their own forms by bench tests (or finite element modeling).
Actually, they did about this, but at the same time it turned out that.
It is clear that “bench experimenters”, in contrast to “polygon” ones, are available for synchronous observation a true disturbing process. This gave them a big advantage - they could determine the true transfer functions and use the available hardware and software to experimentally determine their own forms and frequencies of structural vibrations (based on couvfitting, “cutting” the frequency ranges “by eye” and indicating to the system how many forms there are find; also rather art than science, but still).
However. They clearly avoided exploring an object such as a car assembly, preferring individual frames, supporting bodies, etc. - objects with very low damping. It is about modal bench tests - the determination of natural frequencies and shapes. Not about simulation. Plausible intrinsic modes of vibration on slightly more strongly damped objects can be experimentally obtained experimentally, but significantly more difficult.
Very valuable information turned out to be about these "preferences." If very, very briefly, only the conclusions that were subsequently reached gradually: to strive to decompose the response precisely on the true proper forms of the construction is hardly worth it, despite the "beauty" of the idea.
If it’s “on your fingers”, then the reason is likely with a high probability, such - depending on the external disturbance, “natural modes of vibration” (more precisely, stationary “modal” processes corresponding to natural modes of vibration) will most likely be like this or otherwise, they are correlated with each other, actually forming some other spatial forms of vibrations, to one degree or another different from their own, and this naturally manifests itself in a strong dependence on the damping of the structure.
As a brief explanation “from the contrary” - two different “undamped” harmonics are uncorrelated, of course, always nothing. (Explanation. The aforementioned effect of “mixing own forms” is observed both in the absence of “significant nonlinearities” and outside of “complex forms” with “disproportionate” damping in linear systems.)
Based on the foregoing, it is proposed to present the response of the system as the sum of several correlation-independent processes such as certain forms of vibration (bending, torsional, etc.). Such an analysis is very simple, as a rule, it gives very valuable results. The obtained forms may be similar to the eigenmodes of oscillation of the system, or they may not, but they always reflect the behavior of the system precisely under conditions of real external influence. moreover, they reflect as simple and informative as possible, and their sequence, ranked by their variances, is an approximating series.
To obtain the decomposition of interest to us, we consider (1),
or, the same, compactly, (2),
where x is the n-channel physical response of the system with the duration of N samples directly obtained in the experiment, q is the m-channel real “modal” process with mutually uncorrelated channels, H is the matrix of columns describing the desired in-phase (“real”) modes of vibration.
Generally speaking, m is subsequently expectedq have rank n, (2) in any case, is satisfied without a residual, we obviously arrive at
or in more detail.
That is, the search for the sought-for such “pseudo-proper” modes of vibration and the corresponding uncorrelated (with zero lag) processes q reduces to the spectral decomposition (in terms of eigenvectors and numbers) of the symmetric matrix Rxx [0] (composed of the values of auto- and cross-correlations processes x with lag Δτ = 0) Its own orthonormal vectors give us the desired shapes, and the real eigenvalues give the variances of the corresponding processes (in addition to the significant ones, there will most likely be variances of ~ 0, therefore, in practice, typically m
To clarify the above, we consider a model of a linear mechanical system with five degrees of freedom, approximately simulating the behavior of a string in a viscous medium (Fig. 2),
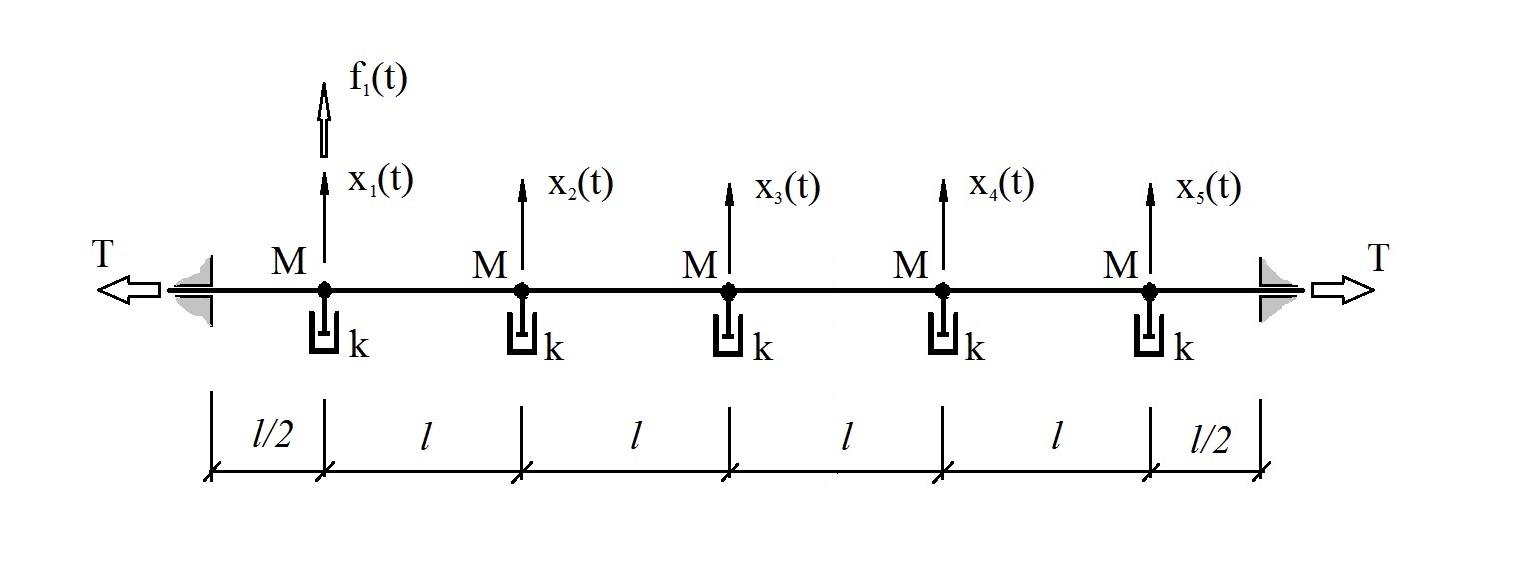
Fig. 2 Test system.
oscillating under the influence of stochastic disturbance f 1 [i] of the type of pink noise (Fig. 3), sampling interval Δt = 0.01 s, implementation length 25000 samples. (Hereinafter, the PSD estimates are obtained by the Welch method, segment length 1024, the Hamming window is applied and 60% overlap of segments.)
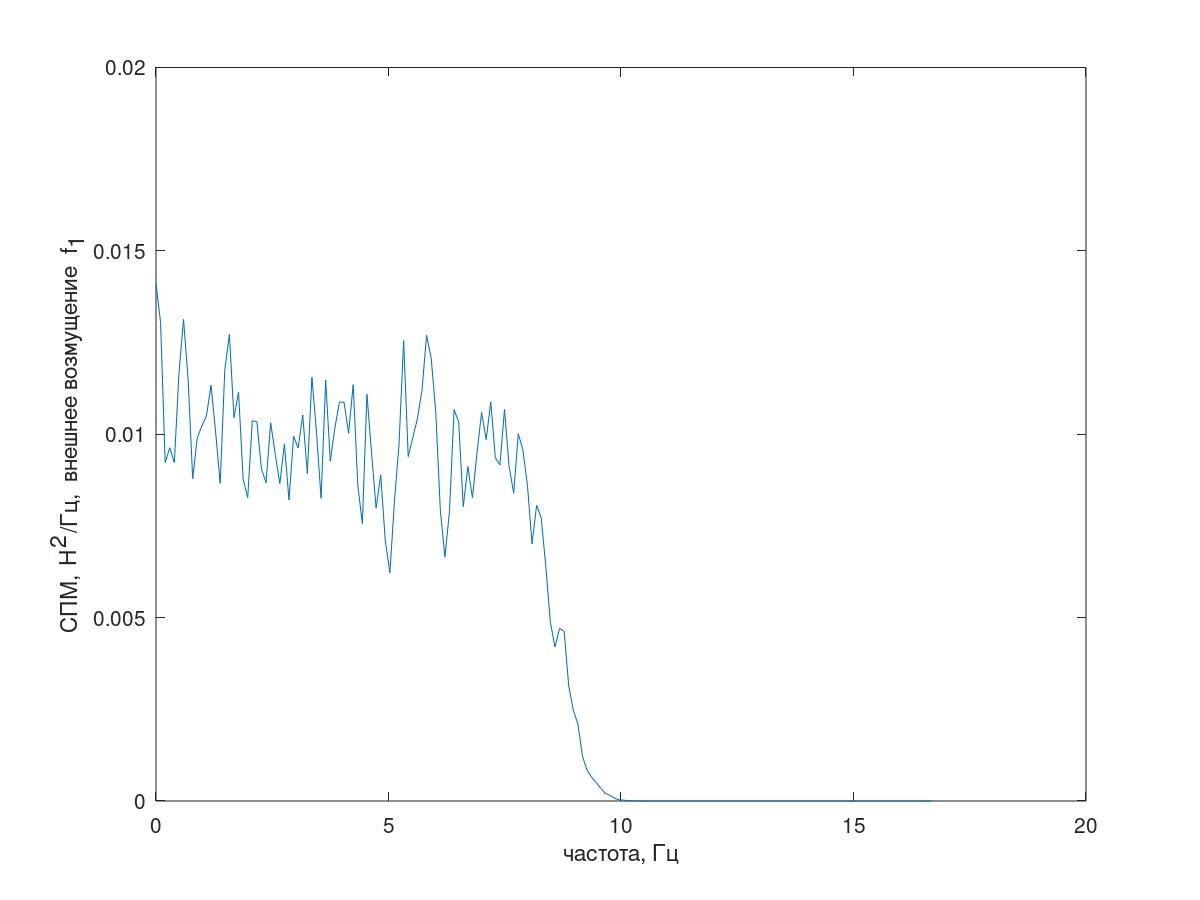
Fig. 3 Spectrum of external disturbance.
A fragment of the temporary implementation of the disturbance is shown in Fig. 4.
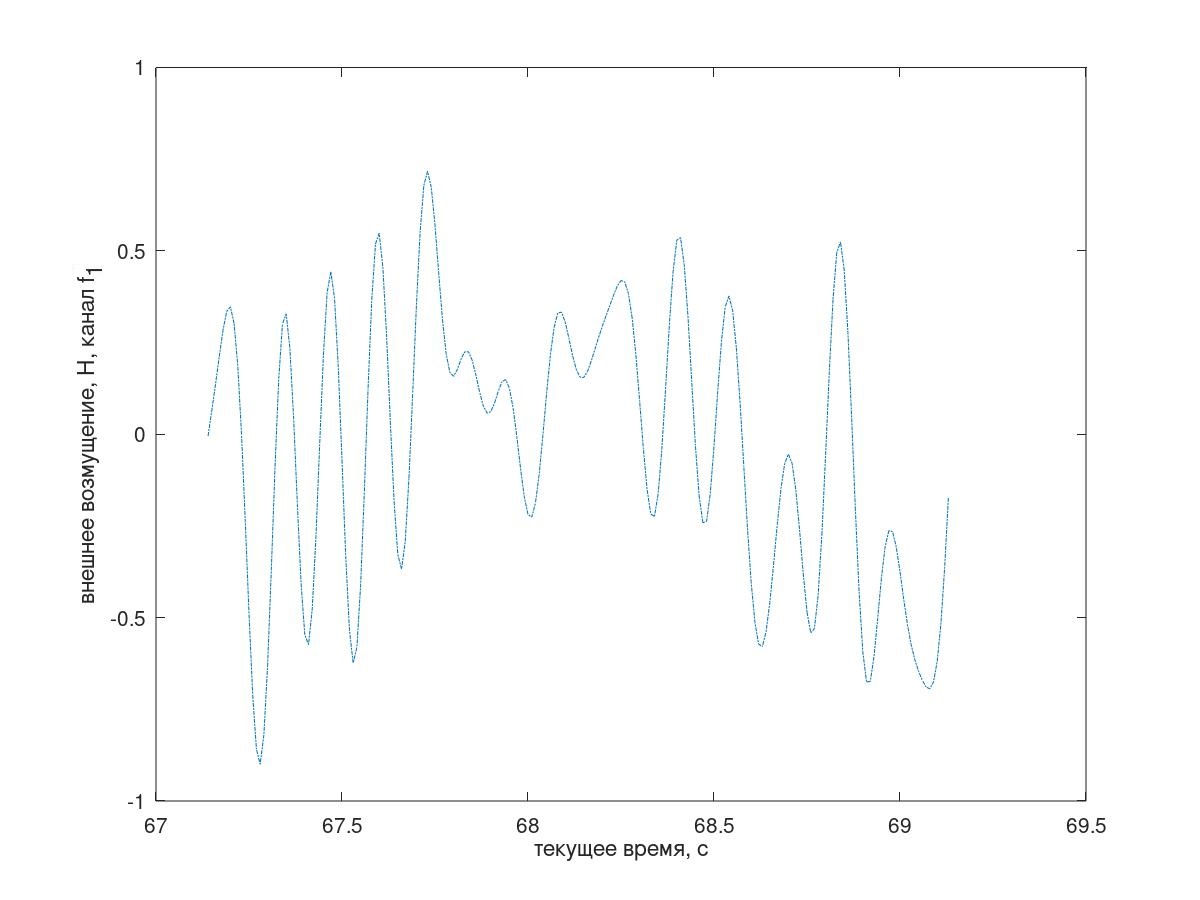
Fig. 4 A fragment of the temporary implementation of the incoming disturbance
In continuous time, the model is a system of diffequations (6),
where M = 1kg, k = 10kg / s, T = 2000N, l = 1m.
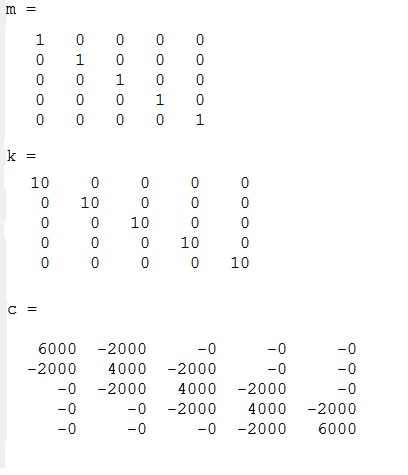
The corresponding (it is clear which) matrices are numerically equal to the following:
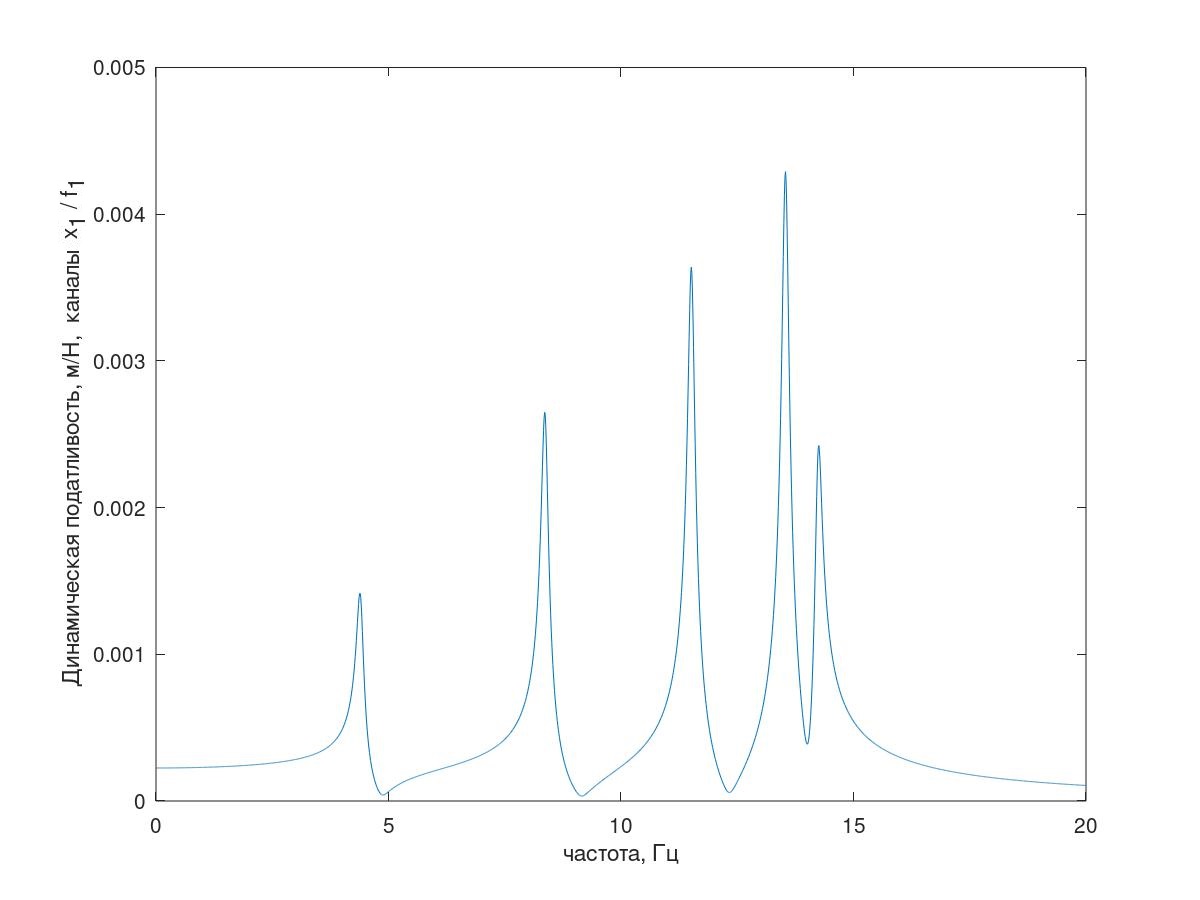
One of the frequency response of the system is shown in Fig. 5.
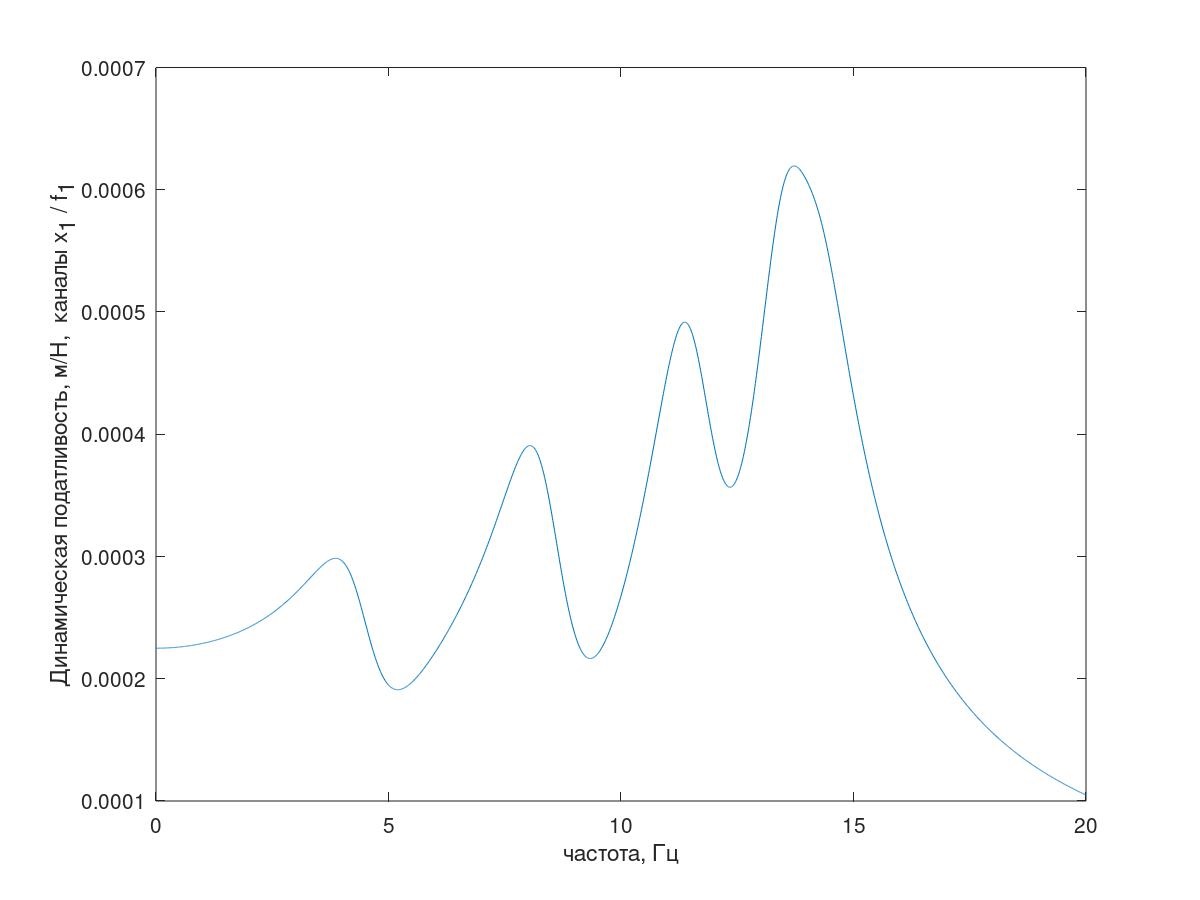
Fig. 5. Frequency response of the test system
(Explanation - everything is in order with the number of resonant peaks, as an explanation of this frequency response of the system with conditionally reduced damping (k = 1 kg / s) is shown in Fig. 5)
Fig
. 6 Explanation about five resonances.
For simulation in discrete time, a finite-difference model is used (Raman models work well at small sampling intervals, as was shown ).
A small digression. Some time later, in the framework of another work, finite-difference modeling of this test system by other means was carried out (Xcos \ Simulink). Mathematically, the models are identical. Animated images of the response of the system to a single impulse at node No 1 and node No 3 were obtained. The results are interesting here from the point of view of verification of the finite-difference model.

(The "unpredictable" buffering of free software frames spoils the images somewhat, especially the second, but, in principle, the result is very good.)
But back to our Matlab (GNUOctave) model. The resulting response spectrum is shown in Fig. 7.
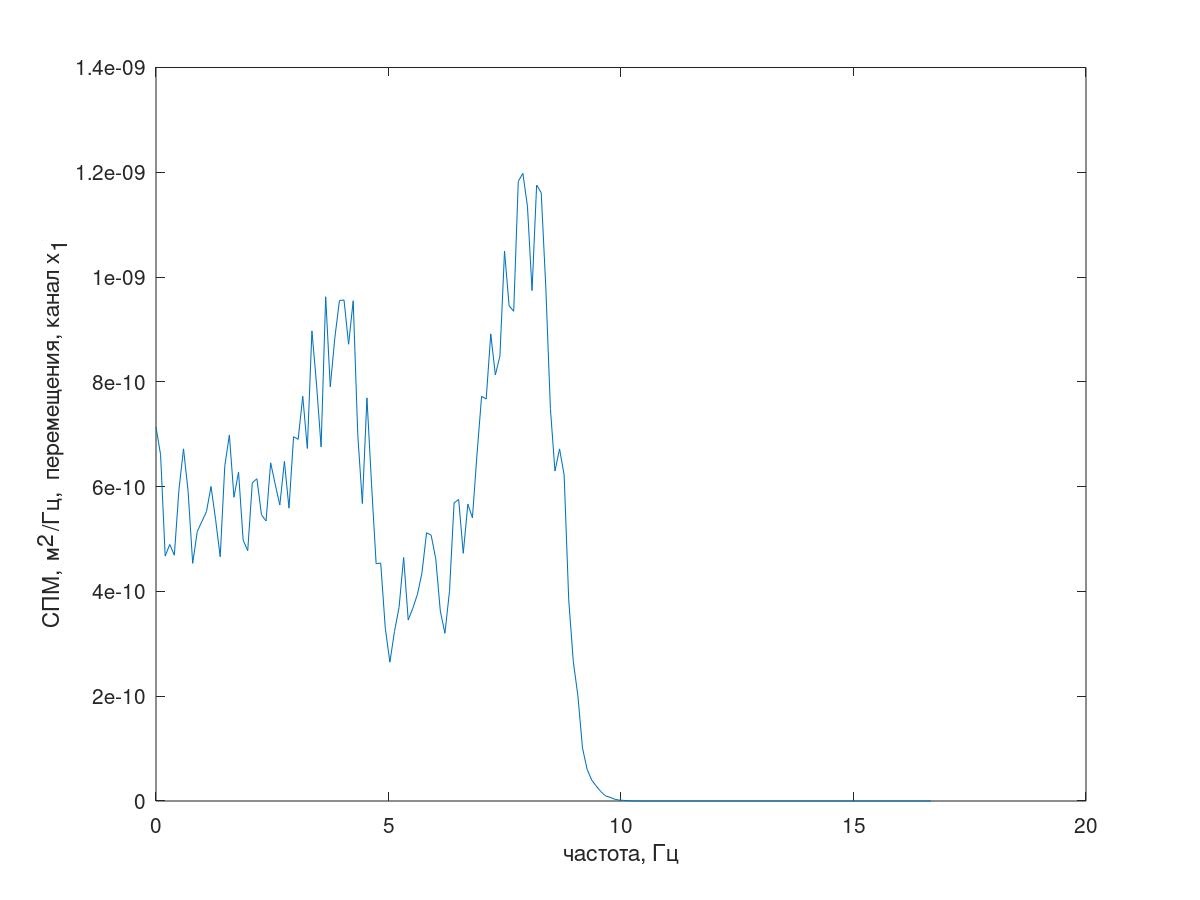
Fig. 7 Response spectrum (channel x 1 )
Next, the correlation method found the values of auto and cross correlations of the response channels.
The results of applying the method under discussion: the variances of pseudo-modal processes Rqq and the pseudo-specific forms H themselves were found:

Quantitatively significant (by the values of their variances in Rqq), apparently, the first three processes in the decomposition, the animation of the entire multi-channel process and the corresponding first three modes of vibration in 32 counts (from 6714 to 6746 counts, i.e., from 67.13 s to 67.63 s of the current time) are shown in Fig. 1 at the beginning of the article. As you can see, these pseudo-forms have some similarities with their own forms of string vibrations.
The accumulated experience indicates the following features of this method.
This may not be completely clear to those who do not encounter a problem regularly, but - looking at the corresponding animation of a process stochastic in time and space, as a rule, is almost pointless. Where it breaks or why it shakes like that - usually “not visible”. What they came up with besides animation, I’ll tell you below, but I’ll recommend this.
By means of an elementary procedure, one can also obtain the spatial “forms” of the oscillations themselves, moreover, it is precisely the actual manifestations under given loading conditions and the intensity of their manifestation (dispersion; if desired, the processes themselves).
| The original multi-channel process  | Decomposition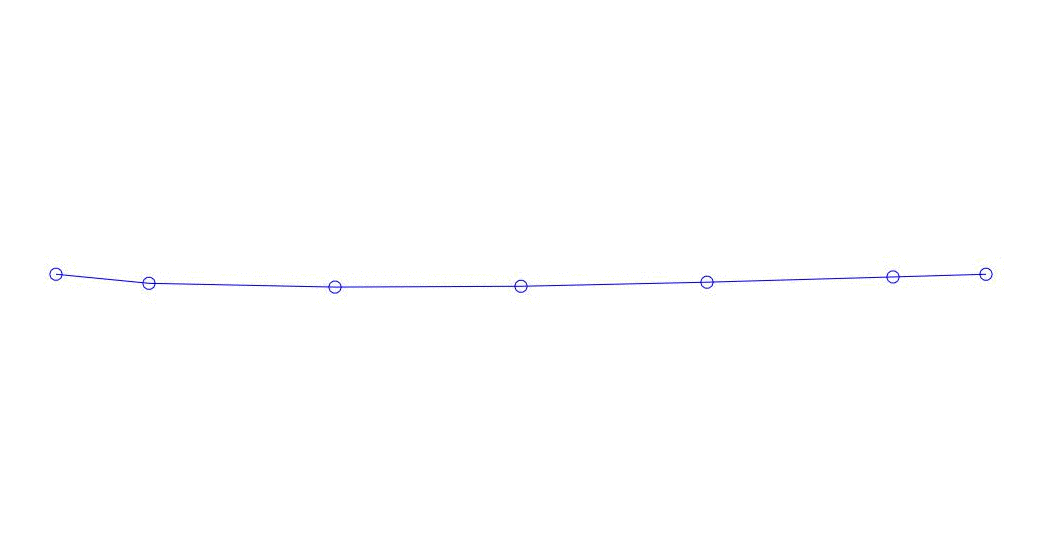 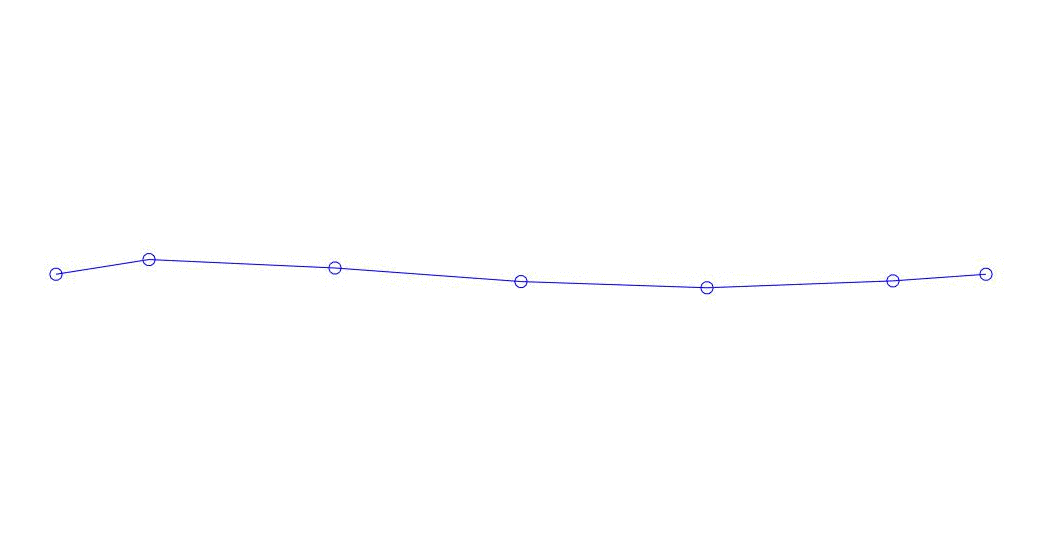 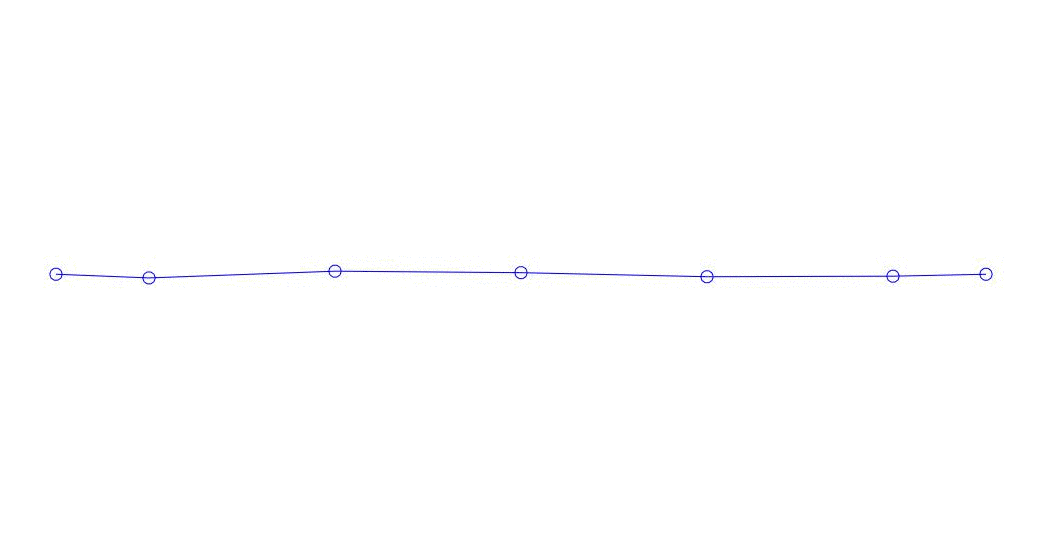 |
Fig. 1 Decomposition of a multi-channel response into pseudo-forms. “String in a viscous medium” (see fig. 2)
In addition to animation, “pairwise” studies (mutual spectra, etc.) are known which, of course, do not give a general picture.
Such methods are quite obvious - by “cutting out” very narrow bands of the spectrum corresponding to resonant peaks in the spectrograms, spectrogram (again “pairwise”) methods produce almost-forms of almost-harmonic (highly correlated) vibrations.
In addition to the obvious technical complexity, the disadvantage of such methods is that you usually need to "successfully" choose a "reference" channel, which is not always possible. As a result, very large errors occur in the mutual phases of the processes. In addition, the distinguished spatial form of oscillations and without such errors, due to the properties of a linear system, can turn out to be “complex” (non-phase), which its value for subsequent subjective analysis usually (not always) significantly reduces.
A 4-channel study of torsional vibrations (the carrier system of an average bus) is known, which is allocated in one process using the spatial vibrational shape determined by the researcher’s inspiration - the readings of two sensors located diagonally at the corners of the body were added (taken from “+”), from they were subtracted (taken from “-”) the testimony of two others located axisymmetrically.
Even with a small number of sensors, this approach may not be entirely good. For example, a truck’s frame is usually much more malleable in the sub-engine (front) part, respectively, a torsional shape, perhaps it should be assumed in a more complex form (probably with some “increasing” coefficients for the front sensors - and at the same time, the question of substantiating the accepted models). With a larger number of surveillance channels, all this is very complicated and poorly justified.
The explicit separation (into separate processes) of several forms of vibrations (modes), previously determined from another experiment or modeling, was once proposed by me (probably not only by me) and was called by my chief then “the method of modal decomposition”. It was supposed to analyze the results of field tests in such a way, and to determine the vectors of their own forms by bench tests (or finite element modeling).
Actually, they did about this, but at the same time it turned out that.
It is clear that “bench experimenters”, in contrast to “polygon” ones, are available for synchronous observation a true disturbing process. This gave them a big advantage - they could determine the true transfer functions and use the available hardware and software to experimentally determine their own forms and frequencies of structural vibrations (based on couvfitting, “cutting” the frequency ranges “by eye” and indicating to the system how many forms there are find; also rather art than science, but still).
However. They clearly avoided exploring an object such as a car assembly, preferring individual frames, supporting bodies, etc. - objects with very low damping. It is about modal bench tests - the determination of natural frequencies and shapes. Not about simulation. Plausible intrinsic modes of vibration on slightly more strongly damped objects can be experimentally obtained experimentally, but significantly more difficult.
Very valuable information turned out to be about these "preferences." If very, very briefly, only the conclusions that were subsequently reached gradually: to strive to decompose the response precisely on the true proper forms of the construction is hardly worth it, despite the "beauty" of the idea.
If it’s “on your fingers”, then the reason is likely with a high probability, such - depending on the external disturbance, “natural modes of vibration” (more precisely, stationary “modal” processes corresponding to natural modes of vibration) will most likely be like this or otherwise, they are correlated with each other, actually forming some other spatial forms of vibrations, to one degree or another different from their own, and this naturally manifests itself in a strong dependence on the damping of the structure.
As a brief explanation “from the contrary” - two different “undamped” harmonics are uncorrelated, of course, always nothing. (Explanation. The aforementioned effect of “mixing own forms” is observed both in the absence of “significant nonlinearities” and outside of “complex forms” with “disproportionate” damping in linear systems.)
Based on the foregoing, it is proposed to present the response of the system as the sum of several correlation-independent processes such as certain forms of vibration (bending, torsional, etc.). Such an analysis is very simple, as a rule, it gives very valuable results. The obtained forms may be similar to the eigenmodes of oscillation of the system, or they may not, but they always reflect the behavior of the system precisely under conditions of real external influence. moreover, they reflect as simple and informative as possible, and their sequence, ranked by their variances, is an approximating series.
To obtain the decomposition of interest to us, we consider (1),
or, the same, compactly, (2),
| H q = x (2) |
where x is the n-channel physical response of the system with the duration of N samples directly obtained in the experiment, q is the m-channel real “modal” process with mutually uncorrelated channels, H is the matrix of columns describing the desired in-phase (“real”) modes of vibration.
Generally speaking, m is subsequently expected
| H · Rqq [0] · H T = Rxx [0] (3) |
or in more detail.
That is, the search for the sought-for such “pseudo-proper” modes of vibration and the corresponding uncorrelated (with zero lag) processes q reduces to the spectral decomposition (in terms of eigenvectors and numbers) of the symmetric matrix Rxx [0] (composed of the values of auto- and cross-correlations processes x with lag Δτ = 0) Its own orthonormal vectors give us the desired shapes, and the real eigenvalues give the variances of the corresponding processes (in addition to the significant ones, there will most likely be variances of ~ 0, therefore, in practice, typically m
| q = H T x (5) |
To clarify the above, we consider a model of a linear mechanical system with five degrees of freedom, approximately simulating the behavior of a string in a viscous medium (Fig. 2),
Fig. 2 Test system.
oscillating under the influence of stochastic disturbance f 1 [i] of the type of pink noise (Fig. 3), sampling interval Δt = 0.01 s, implementation length 25000 samples. (Hereinafter, the PSD estimates are obtained by the Welch method, segment length 1024, the Hamming window is applied and 60% overlap of segments.)
Fig. 3 Spectrum of external disturbance.
A fragment of the temporary implementation of the disturbance is shown in Fig. 4.
Fig. 4 A fragment of the temporary implementation of the incoming disturbance
In continuous time, the model is a system of diffequations (6),
where M = 1kg, k = 10kg / s, T = 2000N, l = 1m.
The corresponding (it is clear which) matrices are numerically equal to the following:
One of the frequency response of the system is shown in Fig. 5.
Fig. 5. Frequency response of the test system
(Explanation - everything is in order with the number of resonant peaks, as an explanation of this frequency response of the system with conditionally reduced damping (k = 1 kg / s) is shown in Fig. 5)
Fig
. 6 Explanation about five resonances.
For simulation in discrete time, a finite-difference model is used (Raman models work well at small sampling intervals, as was shown ).
A small digression. Some time later, in the framework of another work, finite-difference modeling of this test system by other means was carried out (Xcos \ Simulink). Mathematically, the models are identical. Animated images of the response of the system to a single impulse at node No 1 and node No 3 were obtained. The results are interesting here from the point of view of verification of the finite-difference model.
(The "unpredictable" buffering of free software frames spoils the images somewhat, especially the second, but, in principle, the result is very good.)
But back to our Matlab (GNUOctave) model. The resulting response spectrum is shown in Fig. 7.
Fig. 7 Response spectrum (channel x 1 )
Next, the correlation method found the values of auto and cross correlations of the response channels.
The results of applying the method under discussion: the variances of pseudo-modal processes Rqq and the pseudo-specific forms H themselves were found:
Quantitatively significant (by the values of their variances in Rqq), apparently, the first three processes in the decomposition, the animation of the entire multi-channel process and the corresponding first three modes of vibration in 32 counts (from 6714 to 6746 counts, i.e., from 67.13 s to 67.63 s of the current time) are shown in Fig. 1 at the beginning of the article. As you can see, these pseudo-forms have some similarities with their own forms of string vibrations.
The accumulated experience indicates the following features of this method.
- The method is sensitive to extraneous noise, including high frequency. There is a danger of obtaining “random” results (with a large random error) and the apparent irreproducibility of the experimental results. It is necessary to carefully filter out the non-working (quantitatively insignificant) part of the frequency range of the multichannel signal. (At one time, work in this direction was even stopped due to reports of experimenters about the "absence" of correlation between channels - the effect of strong noise)
- The best results were obtained with the number of observation channels significantly larger than the number of expected manifestation of vibrational forms (the number of resonant peaks in the studied range), i.e. for m <
- With high Q factors, pseudo-form systems seem to tend to the true intrinsic modes of the system. The results obtained on such systems are more stable in case of noise.
- If the pair of eigenvalues Rxx [0] coincides or even converges, the pair of the corresponding pseudo-forms is apparently determined up to their independent linear combinations — such forms cannot be separated among themselves under given experimental conditions.
- Apparently, comparing the true forms (found by other methods) and the considered pseudo-forms, with some probability it is possible to find the points of application of the external perturbation (especially with a small-channel perturbation), if such a problem is relevant.