2. Check Point Log Analysis: SmartEvent
- Tutorial
Hello colleagues. Last time, in the article “1. Check Point Log Analysis: The Official Check Point App for Splunk ” we discussed parsing the Security Gateway logs based on the official app in the Splunk logging system. In conclusion, we came to the conclusion that at least the application as a quick solution is very convenient, but at this stage it is unfinished - there are not a large number of dashboards that are very important for the security engineer to understand in order to understand what is happening in the organization from the point of view of information security. In this article we will discuss the possibilities of viewing and analyzing logs with SmartEvent functionality, which you should pay attention to, and consider what options for automating events are available.
SmartEvent compares logs from all Check Point gateways to identify suspicious activity, track trends and investigate security incidents. Data analysis takes place in real time, which allows you to quickly respond to an event. SmartEvent is included in the list of products on the management server; however, it requires a separate license, consists of views and reports that you can create yourself or use pre-installed ones.
In fact, in order for the functionality to work, you just need to enable the blade in the management server settings, you immediately get a set of reports that can be generated, besides there is an opportunity to create new reports depending on your tasks, and the rules for automating events are configured in the SmartEvent Settings & Policy snap-in.
Consider the standard SmartEvent reports first. I also draw your attention to the fact that the version of the GAIA R80.20 operating system is on the management server.
SmartEvent Standard Reports
Thanks to a large number of predefined, easily customizable security events, you can run SmartEvent and start collecting threat information in minutes. Immediately after activating the blade, you get the opportunity to create a large number of standard SmartEvent reports, which you can see in the image below.
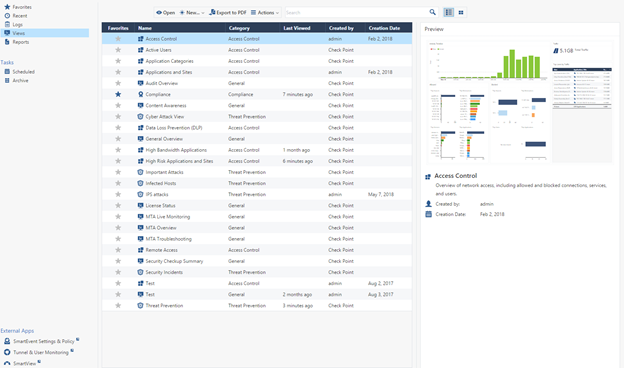
Integrated reporting allows you to implement a continuous process of protection. And this is a prerequisite for information security.
Let's walk with a small overview of the main views and reports.
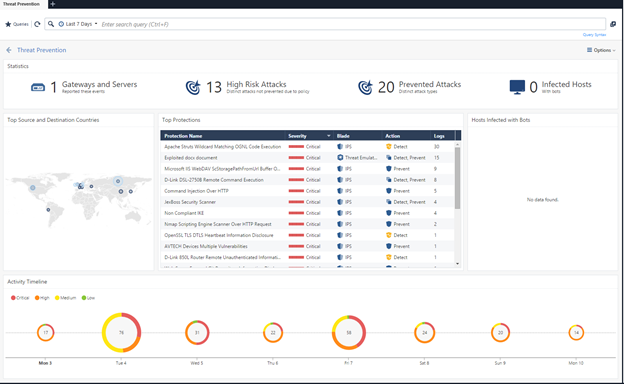
1) Threat Prevention
The most interesting information in this review is a list of all IPS signatures that were only detected, but were not blocked. According to the security policy settings, many signatures can only be detected, this is not desirable, but even worse, when these signatures were seen in traffic and no further action is taken, there can always be such an event variant that this particular signature can be a threat to your infrastructure. therefore, an engineer must look through this report and take action on these events, for example, transfer signatures to Prevent mode. You should also check the hosts that the Security Gateway has identified as infected machines.
2) Security Checkup Summary
I think if you already have Check Point or you have tested this product, then you know this report for sure. Security Checkup Summary gives you a complete picture of the state of information security in your organization and unwanted processes that occur in your infrastructure. However, I cannot advise using the report as a daily material for the work, as a huge amount of information will simply interfere and distract. It is more sensible to generate a report with a certain periodicity for comparison with its previous version in order to make sure that changes in the security policy brought positive actions.
3) User Activity
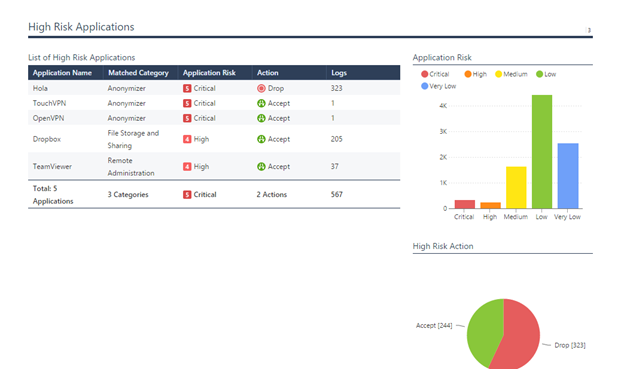
A very convenient report of internal user activity, however, from my point of view, it is more convenient to show separately the statistics of the use of High Risk Applications by users, rather than simply listing all applications.
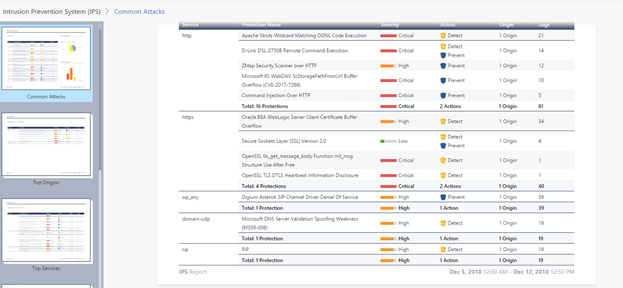
4) Intrusion Prevention System (IPS) A
smart report on monitoring the operation of the IPS system, for me the most interesting table is Top Services and Top Connections. This report helps a lot to properly optimize the IPS system for services, as a result, based on this report, you can identify the actions of attackers to find vulnerabilities in your infrastructure, and then in turn you can correctly configure the Threat Prevention policy for services without disrupting business processes.
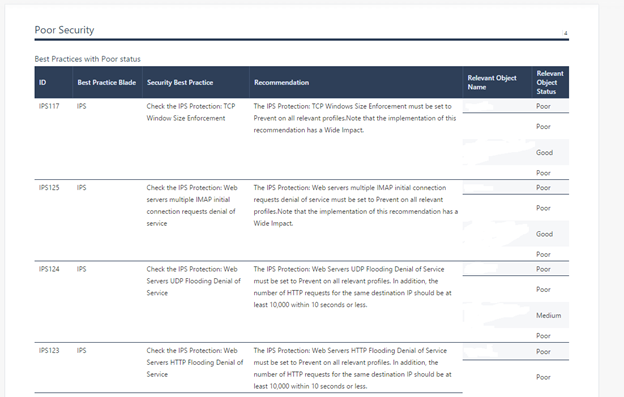
5) Compliance Blade
The Check Point Compliance Software Blade is an integrated solution for monitoring compliance with the requirements of existing IT security techniques.
This report contains suggestions for changing policies to comply with best practice and basic IS standards. If you do not know how to secure your infrastructure properly, then these recommendations give a good idea of how to configure the firewall, however, you should understand which processes should be blocked and which should not be applied to your organization. I'm not sure that it will be interesting for you to see this report every day, but it’s definitely worth reading at least once.
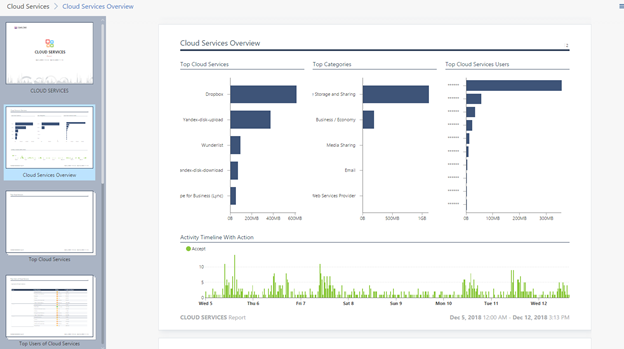
6) Cloud Services
In the report on the use of cloud applications, you will see statistics on the use of cloud services, as a rule, the most interesting thing here is of course the use of cloud disks, and how many MB are downloaded and downloaded, in the report you will see only summary statistics, it is more important to watch how much traffic users merge from jobs in cloud drives, since these can be documents that make up confidential information.
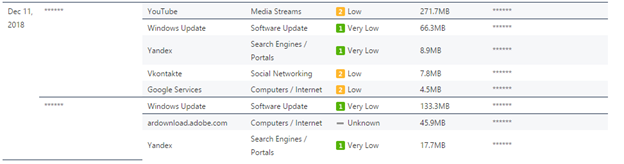
7) Application and URL Filtering
I have no doubt that “Application and URL Filtering” is the most popular preset report. “Application and URL Filtering” contains information about visits to both potentially dangerous and most popular sites. The statistics on the most visited categories, sites, and the amount of traffic for each individual user are collected, a clear understanding of what employees are doing comes. An indispensable document when drafting and updating rules for application control and URL filtering blades.

You can also read the article “Check Point Dashboards, which is what I love,” in which you can get acquainted in more detail with dashboards, functional capabilities, and accordingly, why they love it so much.
Create your report
Although the preset reports are very convenient, you can’t put all the mushrooms in one basket. Almost all engineers are faced with the need to customize their reports, which will contain information that is potentially important for the performance of their work functions, following the characteristics of the device and the nature of the work of the organization.
Once we mentioned the desire to collect statistics on the amount of traffic that goes to cloud applications, let's try to create a typical example - a table. Let's create a report on traffic uploaded to cloud drives, which will include information on users, IP addresses, and the amount of traffic sent to cloud applications.
Create a report - select the New Report menu , set the name Cloud Service Traffic .
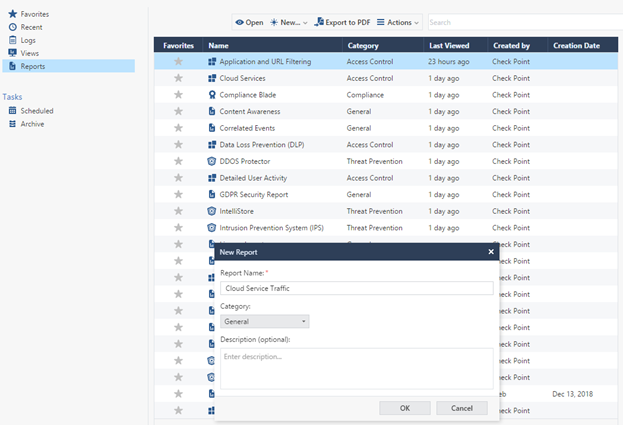
Next, add a table to an empty page: Add Widget -> Table .
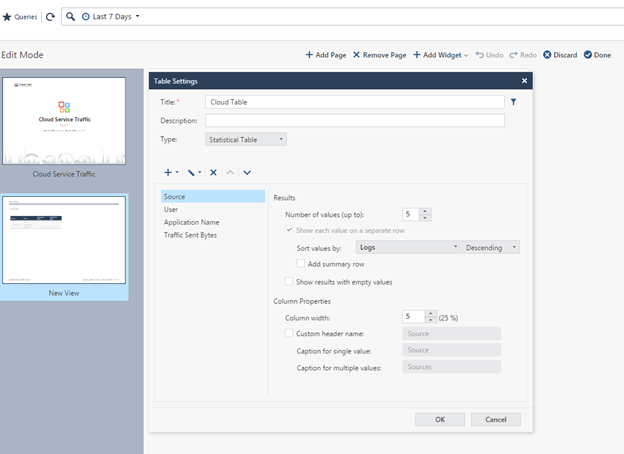
Set the name of the table, for example 'Cloud Table' , then leave the type Statistical Table . In this case, the calculated summarized statistical data will be shown, if you select the Log Table , the table will consist of data for each individual event, in the context of our task, we do not need this option.
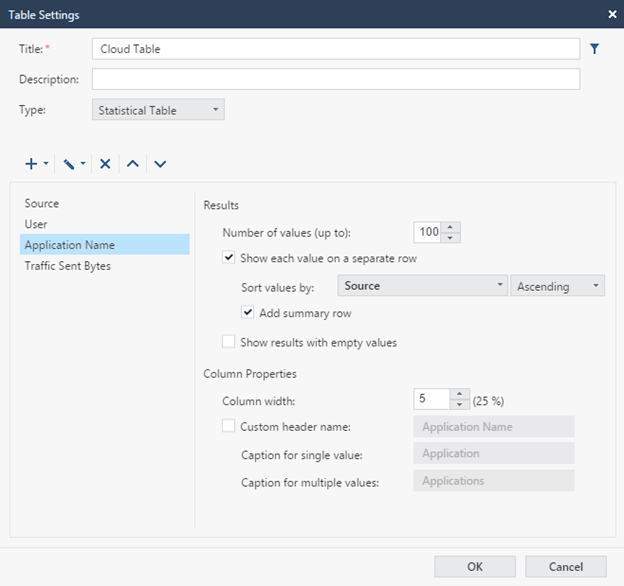
Next, you need to decide on what parameters the table will be built, you need to see the user, the name of the cloud application where the data is downloaded, the amount of outgoing traffic, and also consider the option when the user name is missing, that is, you need to add an additional column with the IP address There is a connection. Accordingly, select the parameters Source , User , Application Name , Traffic Sent Bytes .
Next you need to properly configure and sort the parameters. As the first parameter, select Source, depending on the size of the organization, set the maximum number of values ( Number of values), I indicated 100, sorted by eigenvalue, as this is the main parameter that does not depend on the other parameters.
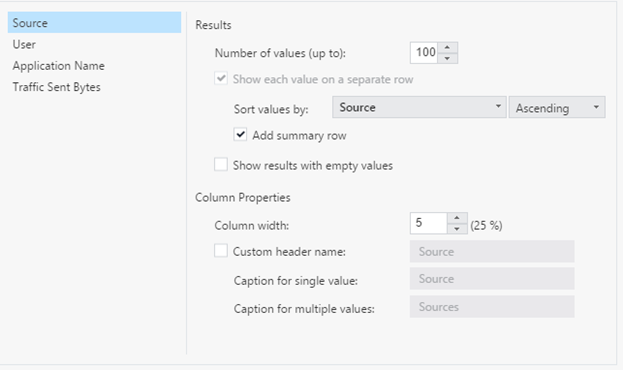
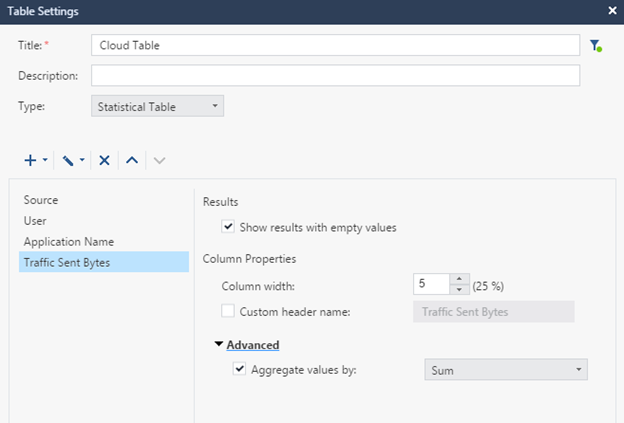
Next, set up in a similar way the parameters User , Application Name and Traffic sent bytes . Just sort the results by Source.
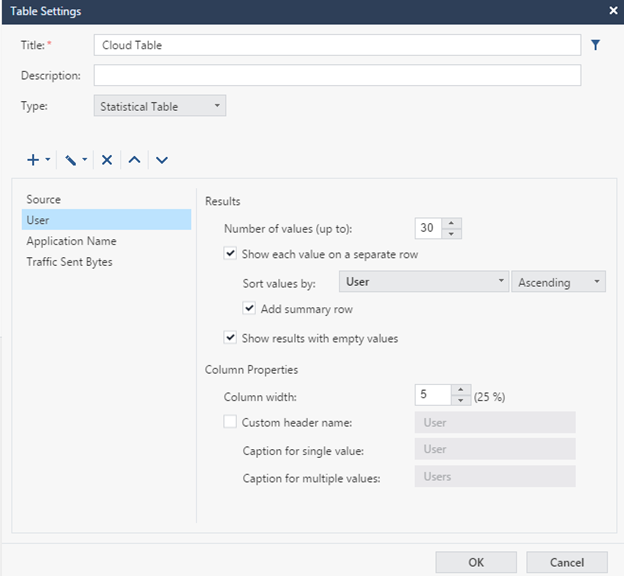
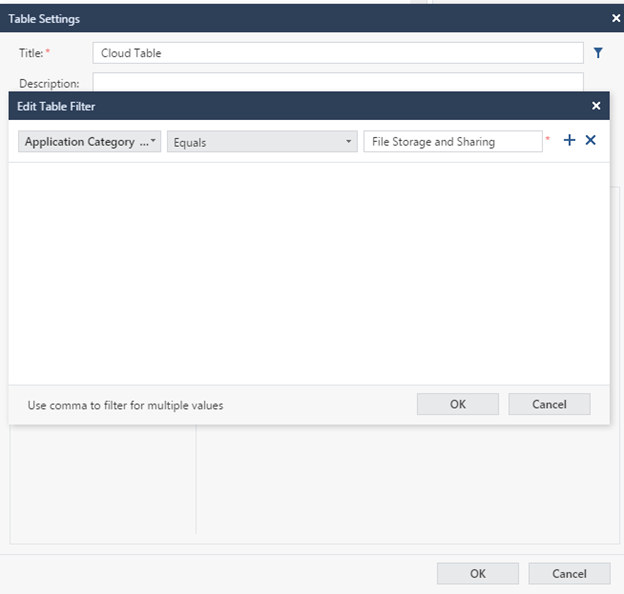
We set the structure, as a result, a table will be issued for all users and applications, of which there are a huge number, and we are only interested in cloud applications, to solve this question, we will set a filter (an icon located on the same level as the Title).
For the field, select the Application Category , the Equals operation , set the group name — File Storage and Sharing .
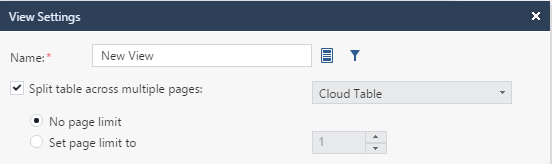
After that we stretch the table to the whole page, save the changes - Done. Also, if we have a large number of results in the table, and everything does not fit on one page, you should install the extension of the results on new pages, for this we go in Options -> View Settings .
As a result, we get a ready-made table, you can study the results.
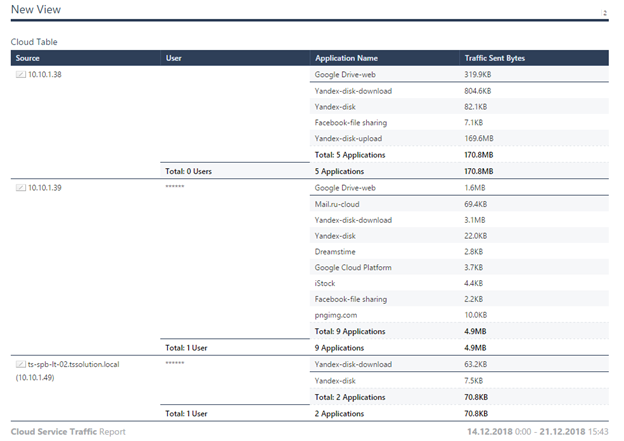
You can also customize graphs, charts, and so on. The principle is about the same everywhere. The toolkit for the average user is fairly transparent and does not require special talents. It remains to consider the automation functionality in SmartEvent, which is not very popular, but from my point of view, plays an important role in ensuring information security processes.
SmartEvent Automation
In SmartEvent, there is a special utility with the same name for managing the blade, which allows you to customize the generation and correction of security events, and automate actions to these events.
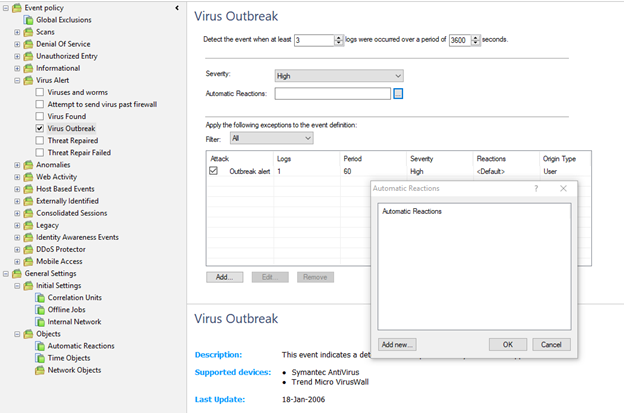
The management tree is divided into 2 branches: Event Policy and General Settings. All events detected by SmartEvent are categorized by category in the event policy branch. When you select an event, its custom properties are displayed in the details panel, and the event description is displayed in the description panel. Clearing the property removes this type of event from the policy during the next installation.
In General Settings, the initial settings are set, but most likely the only thing that will be needed there is this:
- the Offline Jobs setting is the upload of old logs to SmartEvent, which were either not on the management server, or SmartEvent was turned on after these logs were created.
- Create automatic actions in Automatic Reactions.
For each policy, you can set an automatic action.
An automatic action is the execution of a specified set of actions subject to the execution of an event, which includes:
- Email sending
- Sending SNMP traps
- Source IP Blocking
- Block attack (Block Event activity)
- Execute external script.

Each option is quite applicable in real life depending on the event on which you set the automatic action, for example, for some events of a controversial nature, you can set the action for sending the letter to the engineer, and for other events blocking the IP address, for example, in case of an attempt to scan your network or virus attack. Automatic action is superimposed in the event properties.
You can configure the script to run on a specific event, but in this mode, I believe that this is not very convenient and appropriate, since the functionality is rather limited, and you cannot configure the input to the script, since it is required for certain tasks, you can easily make a mistake because the triviality of the system, so everything related to scripts is better left to logging systems like Splunk + Check Point API, a greater scope of possibilities and practically unlimited functionality.
Conclusion
Let's highlight the main reports that should be of interest to the information security engineer:
- Threat prevention
- Intrusion Prevention System (IPS)
- Application and URL Filtering
- Custom reports
If we consider SmartEvent as a simple logging and analysis system, which also provides all the necessary reports with minimal pre-settings, then this is the ideal solution.
A trivial interface to create your reports, all that is needed for the subsequent analysis of security incidents, and the maintenance of information security processes in the organization. What is a continuous process and requires the continued participation of the engineer. But if we consider this product as a SIEM solution, then it has shortcomings, limited functionality for automation and event correlation, is difficult to configure, and it is impossible to build on this basis a single center for monitoring and managing the information security system in the organization. Consider all the details and compare the various solutions for analyzing Check Point logs in the following articles.
Только зарегистрированные пользователи могут участвовать в опросе. Войдите, пожалуйста.