"Reliability and dependability as in Google" - and not only: translation of the article "Calculation of reliability of service"
- Transfer

The main task of commercial (and non-commercial too) services is to be always accessible to the user. Although failures happen to everyone, the question is what does the IT team do to minimize them. We translated Ben Treynor, Mike Dalin, Vivek Rau, and Betsy Beyer’s article Reliability Service Calculation, which includes, for example, Google, why 100% is an incorrect guideline for the reliability indicator, what the “four nines” and in practice, how to mathematically predict the admissibility of large and small service outages and / or its critical components — the expected amount of downtime, failure detection time and service recovery time.
Calculation of service reliability
Your system is only as reliable as its components.
Ben Traynor, Mike Dahlin, Vivek Rau, Betsy Beyer
As described in the book “ Site Reliability Engineering: Reliability and Reliability as Google ” (hereinafter referred to as the SRE book), the development of Google products and services can achieve a high rate of release of new functions, while maintaining aggressive SLOs (service-level objectives, service level goals). ) to ensure high reliability and quick response. SLOs require that the service is almost always in good condition and almost always fast. At the same time, SLOs also indicate the exact values of this “almost always” for a particular service. SLOs are based on the following observations:
In general, for any software service or system, 100% is an incorrect benchmark for the reliability index, since no user will be able to notice the difference between 100% and 99.999% availability. Between the user and the service there are many other systems (his laptop, home Wi-Fi, provider, power grid ...), and all these systems are not available in 99.999% of cases, but much less often. Therefore, the difference between 99.999% and 100% is lost against the background of random factors caused by the unavailability of other systems, and the user does not get any benefit from the fact that we spent a lot of strength, achieving this last fraction of the percent availability of the system. Serious exceptions to this rule are anti-lock braking systems and pacemakers!
For a detailed discussion of how SLOs relate to SLI (service-level indicators, service level indicators) and SLA (service-level agreements), see the “Target Quality of Service” chapter in the SRE book. This chapter also describes in detail how to select metrics that are relevant to a particular service or system, which, in turn, determines the choice of the appropriate SLO for that service or system.
This article extends the topic of SLO to focus on the component parts of services. In particular, we will look at how the reliability of critical components affects the reliability of the service, as well as how to design systems to mitigate the impact or reduce the number of critical components.
Most of the services offered by Google are aimed at providing 99.99 percent (sometimes called "four nines") accessibility to users. For some services, the user agreement indicates a lower number, but within the company the target 99.99% is saved. This higher level gives an advantage in situations where users express dissatisfaction with the service performance long before the event of a violation of the agreement, since the goal of the SRE team No. 1 is to make users satisfied with the services. For many services, the internal target of 99.99% represents the middle ground, which balances cost, complexity and reliability. For some other global cloud services in particular, the internal target is 99.999%.
99.99% reliability: observations and conclusions
Let's look at a few key observations and conclusions about the design and operation of the service with a reliability of 99.99%, and then proceed to practice.
Observation number 1: Causes of failure
Failures occur for two main reasons: problems with the service itself and problems with critical components of the service. A critical component is a component that, in the event of a failure, causes a corresponding failure of the entire service.
Observation number 2: Mathematics of reliability
Reliability depends on the frequency and duration of downtime. It is measured in:
- Frequency of downtime, or the opposite of it: MTTF (mean time to failure, mean time to failure).
- Downtime, MTTR (mean time to repair, average recovery time). The duration of downtime is determined by the user time: from the beginning of the fault to the resumption of normal service operation.
Thus, reliability is mathematically defined as MTTF / (MTTF + MTTR) using the appropriate units of measure.
Conclusion number 1: the rule of additional nines
Service cannot be more reliable than all its critical components combined. If your service seeks to ensure availability at 99.99%, then all critical components must be available significantly more than 99.99% of the time.
Inside Google, we use the following rule of thumb: critical components must provide additional nines compared to the declared reliability of your service — in the example above, 99.999% availability — because any service will have several critical components, as well as its own specific problems. This is called the "extra nines rule."
If you have a critical component that does not provide enough nines (a relatively common problem!), You should minimize the negative consequences.
Conclusion # 2: Mathematics of frequency, detection time and recovery time
Service cannot be more reliable than the product of the frequency of incidents at the time of detection and recovery. For example, three complete outages of 20 minutes per year result in a total of 60 minutes of inactivity. Even if the service worked perfectly during the rest of the year, 99.99% reliability (no more than 53 minutes of downtime per year) would have been impossible.
This is a simple mathematical observation, but it is often overlooked.
Conclusion from conclusions No. 1 and No. 2
If the level of reliability that your service relies on cannot be achieved, efforts should be made to correct the situation, either by increasing the availability of the service or by minimizing the negative consequences, as described above. Lowering expectations (i.e., declared reliability) is also an option, and often the surest: let the service-dependent service know that it must either rebuild its system to compensate for the uncertainty in the reliability of your service, or reduce its own service level goals . If you do not correct the discrepancy yourself, a fairly long system outage will inevitably require corrections.
Practical use
Let's consider an example of a service with a target reliability of 99.99% and work out the requirements for both its components and its handling of failures.
Numbers
Suppose your 99.99% available service has the following characteristics:
- One major outage and three minor outages per year. This sounds frightening, but note that the target reliability level of 99.99% implies one 20-30 minute large-scale simple and several short partial outages per year. (Mathematics indicates that: a) failure of one segment is not considered a failure of the entire system in terms of SLO and b) overall reliability is calculated by sum of the reliability of the segments.)
- Five critical components in the form of other independent services with a reliability of 99.999%.
- Five independent segments that can not refuse one after another.
- All changes are carried out gradually, one segment at a time.
The mathematical calculation of reliability will be as follows:
Component Requirements
- The total error limit per year is 0.01 percent of 525,600 minutes per year, or 53 minutes (based on the 365-day year, in the worst-case scenario).
- The limit for shutting down critical components is five independent critical components with a limit of 0.001% each = 0.005%; 0.005% from 525,600 minutes per year, or 26 minutes.
- The remaining error limit of your service is 53-26 = 27 minutes.
Trip Response Requirements
- Expected number of downtime: 4 (1 full shutdown and 3 shutdowns affecting only one segment)
- Cumulative impact of expected outages: (1 × 100%) + (3 × 20%) = 1.6
- Failure detection and recovery time: 27 / 1.6 = 17 minutes
- Time allotted to monitoring for fault detection and notification: 2 minutes
- The time given to the specialist on duty to begin analyzing the alert: 5 minutes. (The monitoring system should track SLO violations and send a signal to the pager on duty every time the system crashes. Many Google services are supported by shift SR-on-duty engineers who respond to urgent questions.)
- Remaining time to effectively minimize negative effects: 10 minutes
Conclusion: leverage to increase service reliability
It is worth looking closely at the presented figures, because they emphasize a fundamental point: there are three main levers to increase the reliability of the service.
- Reduce the frequency of outages - due to release policies, testing, periodic evaluations of the project structure, etc.
- Reduce average downtime by using segmentation, geographic isolation, gradual degradation, or customer isolation.
- Reduce recovery time — with monitoring, one-button rescue actions (for example, rolling back to a previous state or adding reserve capacity), operational readiness practices, etc.
You can balance between these three methods to simplify fault tolerance. For example, if it is difficult to achieve a 17-minute MTTR, focus your efforts on reducing average downtime. Strategies to minimize negative effects and mitigate the effects of critical components are discussed in more detail later in this article.
Clarification of the "Rules of additional nines" for nested components
A random reader can conclude that each additional link in a chain of dependencies requires additional nines, so two additional nines are required for second-order dependencies, three additional nine-nines are required for third-order dependencies, and so on.
This is a wrong conclusion. It is based on a naive model of a hierarchy of components in the form of a tree with constant branching at each level. In such a model, as shown in Fig. 1, there are 10 unique first-order components, 100 unique second-order components, 1,000 unique third-order components, and so on, which creates a total of 1,111 unique services, even if the architecture is limited to four layers. The ecosystem of highly reliable services with so many independent critical components is clearly unrealistic.
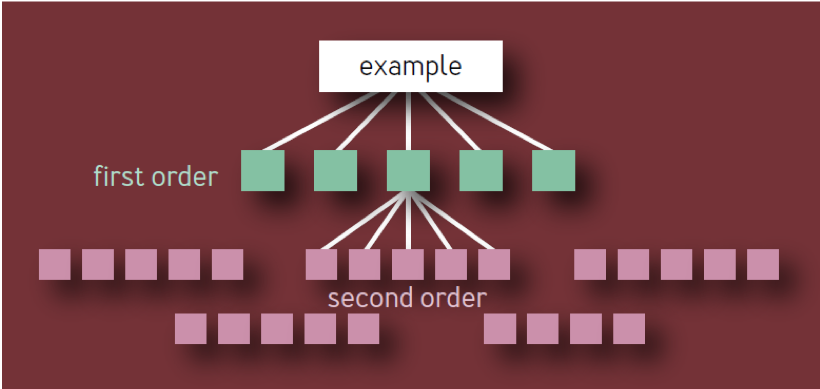
Fig. 1 - Component Hierarchy: Invalid Model
The critical component itself can cause the failure of the entire service (or service segment), regardless of where it is in the dependency tree. Therefore, if a given X component appears as a dependency of several first-order components, X should be counted only once, since its failure will eventually lead to a service failure, regardless of how many intermediate services will also be affected.
The correct reading of the rule is as follows:
- If the service has N unique critical components, then each of them contributes 1 / N to the unreliability of the entire service caused by this component, regardless of how low it is located in the component hierarchy.
- Each component should be counted only once, even if it appears several times in the component hierarchy (in other words, only unique components are taken into account). For example, when calculating the components of Service A in fig. 2, Service B should be considered only once.
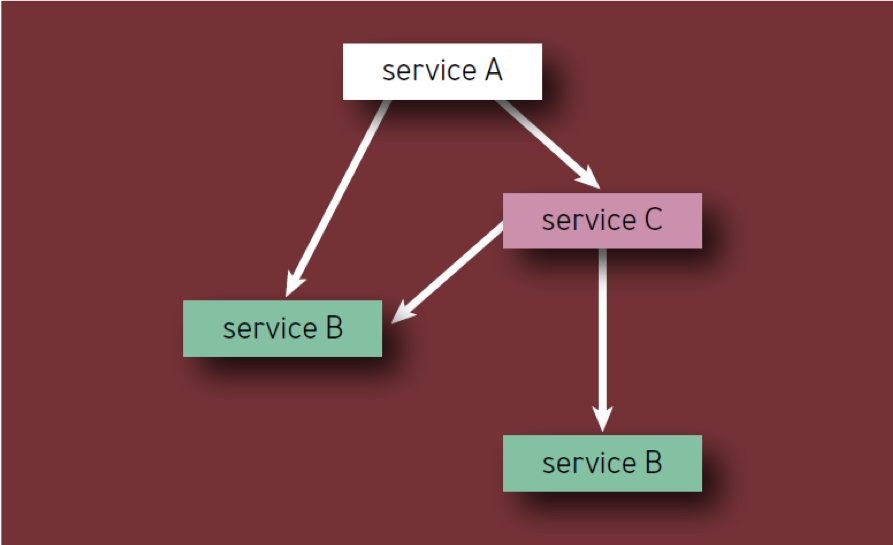
Fig. 2 - Components in the hierarchy
For example, consider a hypothetical service A with an error limit of 0.01 percent. Service owners are willing to spend half of this limit on their own mistakes and losses, and half on critical components. If the service has N such components, then each of them receives 1 / N of the remaining error limit. Typical services often have from 5 to 10 critical components, and therefore each of them can refuse only one-tenth or one-twentieth degree of the error limit of Service A. Therefore, as a rule, critical parts of the service should have one additional nine of reliability.
Error limits
The concept of error limits is described in some detail in the SRE book, but here it should be mentioned. Google's SR engineers use error limits to balance the reliability and pace of updates. This limit determines the allowable failure rate for a service for a period of time (usually a month). Error limit is just 1 minus SLO service, therefore, the previously discussed 99.99% available service has a 0.01% “limit” for insecurity. Until the service consumed its error limit within a month, the development team is free (within reason) to launch new functions, updates, etc.
If the error limit is used up, the changes to the service are suspended (with the exception of urgent security fixes and changes aimed at what caused the violation in the first place) until the service replenishes the margin in the error limit or until the month changes. Many Google services use a sliding window method for SLO so that the error limit is restored gradually. For serious services with an SLO of more than 99.99%, it is advisable to apply a quarterly rather than a monthly zeroing of the limit, since the number of permissible downtime is small.
Error limits eliminate inter-departmental tensions that might otherwise arise between SR engineers and product developers, providing them with a common, data-based product risk assessment mechanism. They also give SR engineers and development teams the common goal of developing methods and technologies that will allow them to innovate faster and launch products without “inflating the budget.”
Strategies to reduce and mitigate critical components
To this point, in this article we have established what can be called the "Golden Rule of Component Reliability . " This means that the reliability of any critical component must be 10 times higher than the target level of reliability of the entire system so that its contribution to the unreliability of the system remains at the level of error. It follows that, ideally, the task is to make as many components as possible non-critical. This means that components can stick to lower levels of reliability, giving developers the opportunity to innovate and take risks.
The simplest and most obvious strategy for reducing critical dependencies is to eliminate single points of failure (SPOF) whenever possible. A larger system should be able to work acceptably without any given component that is not a critical dependency or SPOF.
In fact, you most likely cannot get rid of all critical dependencies; but you can follow some system design recommendations to optimize reliability. Although it is not always possible, it is easier and more efficient to achieve high system reliability if you build reliability during the design and planning stages, and not after the system is working and affecting actual users.
Evaluation of the project structure
When planning a new system or service, as well as when redesigning or improving an existing system or service, a review of the architecture or project may reveal a common infrastructure, as well as internal and external dependencies.
Shared infrastructure
If your service uses a shared infrastructure (for example, a core database service used by several products available to users), consider whether this infrastructure is being used correctly. Clearly identify the owners of the shared infrastructure as additional project participants. In addition, beware of overloading components — to do this, carefully coordinate the launch process with the owners of these components.
Internal and external dependencies
Sometimes a product or service depends on factors beyond the control of your company — for example, software libraries or third-party services and data. Identifying these factors will minimize the unpredictable consequences of their use.
Plan and design systems carefully
When designing your system, pay attention to the following principles:
Backup and Isolation
You can try to reduce the impact of a critical component by creating several independent instances of it. For example, if storing data in a single copy provides 99.9 percent availability of this data, storing three copies in three widely dispersed copies will provide, in theory, an accessibility level of 1 to 0.013 or nine nines, if the instance fails at independent correlation with zero.
In the real world, the correlation is never zero (consider the backbone failures that affect many cells at the same time), so the actual reliability will never approach nine nine, but will far exceed three nine.
Similarly, sending an RPC (remote procedure call, remote procedure call) to one server pool in one cluster can provide 99 percent availability of results, while sending three simultaneous RPCs to three different server pools and accepting the first incoming response helps to achieve the availability level. taller than three nines (see above). This strategy can also shorten the response time delay tail if server pools are equidistant from the RPC sender. (Since the cost of sending three RPCs at the same time is high, Google often strategically distributes the time of these calls: most of our systems expect a portion of the allotted time before sending the second RPC and a little more time before sending the third RPC.)
Reserve and its application
Configure the start-up and transfer of software so that the systems continue to work when individual parts fail (fail safe) and isolate themselves when problems arise. The basic principle here is that by the time you connect a person to include a reserve, you will probably already exceed your error limit.
Asynchrony
To prevent components from becoming critical, design them asynchronous wherever possible. If a service expects a response RPC from one of its non-critical parts, which demonstrates a sharp slowdown in response time, this slowdown will unnecessarily worsen the performance of the parent service. Setting RPC for a non-critical component to asynchronous mode will release the response time of the parent service from binding to the indicators of this component. And while asynchrony may complicate the code and infrastructure of the service, yet this compromise is worth it.
Resource planning
Ensure that all components are fully equipped. If in doubt, it is better to provide an excess reserve - but without increasing costs.
Configuration
If possible, standardize component configuration to minimize discrepancies between subsystems and avoid one-time failure / error handling modes.
Detection and troubleshooting
Make error detection, troubleshooting, and troubleshooting problems as simple as possible. Effective monitoring is the most important factor in the timely detection of problems. Diagnosing a system with deeply embedded components is extremely difficult. Always keep on hand such a way to level errors that do not require detailed intervention of the duty officer.
Fast and reliable rollback to the previous state
Including the manual work of the attendants in the plan for eliminating the consequences of failures significantly reduces the ability to fulfill hard SLO goals. Build systems that can easily, quickly and smoothly return to the previous state. As your system improves and confidence in your monitoring method grows, you can reduce MTTR by developing a system to automatically launch safe kickbacks.
Systematically check all possible failure modes
Examine each component and determine how a failure in its operation can affect the entire system. Ask yourself the following questions:
- Can the system continue to operate in the limited functionality mode in case of failure of one of them? In other words, design the possibility of gradual degradation.
- How do you solve the problem of component inaccessibility in various situations? When starting the service? While the service is running?
Do thorough testing
Develop and implement a developed testing environment that will ensure that each component is covered with tests, including the main use cases of this component by other components of the environment. Here are some recommended strategies for such testing:
- Use integration testing to troubleshoot failures — make sure the system can withstand any component failure.
- Conduct emergency testing to identify weak points or hidden / unplanned dependencies. Record the procedure for correcting the identified deficiencies.
- Do not test the normal load. Intentionally overload the system to see how its functionality is reduced. Anyway, your system’s response to overload will be known; but it is better not to leave the load testing to users, but to pre-test the system yourself.
Plan for the future
Expect scaling changes: a service that begins as a relatively simple binary file on one computer can have many obvious and non-obvious dependencies when deployed on a larger scale. Each scale order will reveal new constraints — not only for your service, but also for your dependencies. Consider what happens if your dependencies cannot scale as fast as you need.
Also keep in mind that system dependencies evolve over time and the list of dependencies may increase over time. When it comes to infrastructure, Google’s typical recommendation is to build a system that will scale up to 10 times the initial target load without significant changes in architecture.
Conclusion
While readers are probably familiar with some or many of the concepts described in this article, concrete examples of their use will help to better understand their essence and convey this knowledge to others. Our recommendations are not easy, but not unattainable. A number of Google services have repeatedly demonstrated reliability above four nines not due to superhuman efforts or intelligence, but through thoughtful application of principles and best practices developed over many years (see SRE book, Appendix B: Practical recommendations for services in industrial operation).