Fine tune load balancing
This article will focus on load balancing in web projects. Many believe that the solution to this problem in the distribution of load between servers - the more accurate, the better. But we know that this is not entirely true. The stability of the system is much more important from a business point of view .
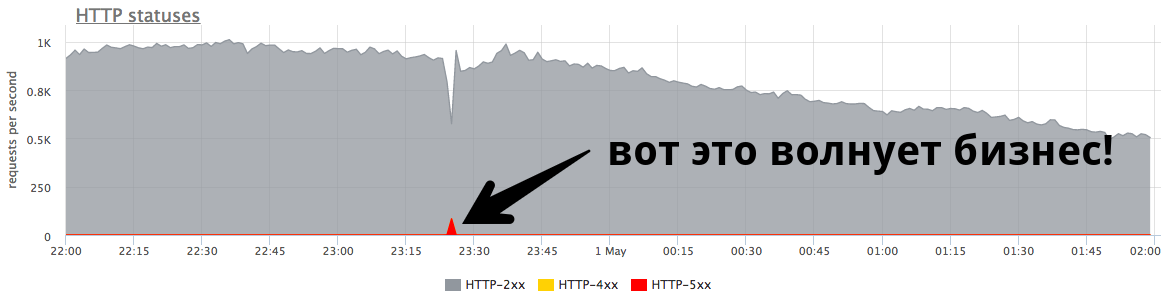
The small minute peak at 84 RPS of “five hundred” is five thousand errors that real users received. This is a lot and it is very important. It is necessary to look for reasons, work on errors and try to continue to prevent such situations.
Nikolay Sivko ( NikolaySivko ) in his report on RootConf 2018 talked about the subtle and not yet very popular aspects of load balancing:
Under cat decoding of this report.
About the speaker: Nikolay Sivko co-founder of okmeter.io. He worked as a system administrator and the leader of a group of administrators. Supervised operation at hh.ru. He founded the monitoring service okmeter.io. As part of this report, monitoring development experience is the main source of cases.
What are we going to talk about?
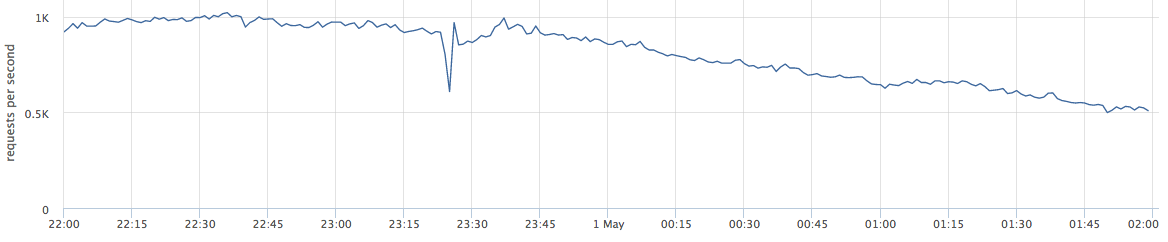
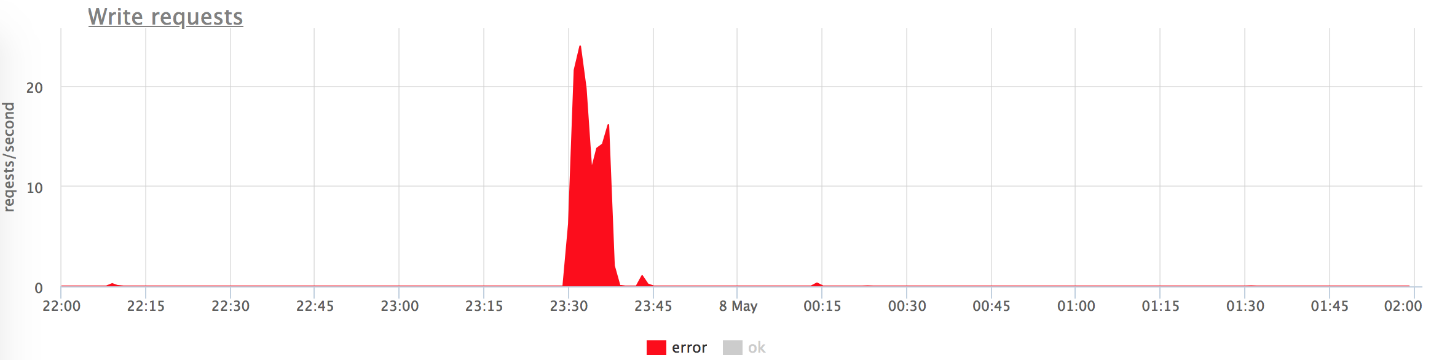
This article will talk about web projects. Below is an example of live production: the graph shows requests per second for a certain web service.
When I talk about balancing, many perceive it as "we need to distribute the load between the servers - the more accurate, the better."
In fact this is not true. This problem is relevant for a very small number of companies. More often business is worried about errors and system stability.
The small peak on the graph is “five hundred”, which the server returned within a minute, and then stopped. From the point of view of a business, such as an online store, this small peak at 84 RPS of “five hundred” is 5040 errors to real users. Some did not find something in your catalog, others could not put the goods in the basket. And this is very important. Although this peak does not look very large on the chart, it is a lot in real users .
As a rule, everyone has such peaks, and admins do not always respond to them. Very often, when a business asks what it was, they answer him:
Often people do not even try to understand the reasons why this happened, and do not do any post-work so that it does not happen again.
Fine tune
I called the report “Fine tuning” (Eng. Fine tuning), because I thought that not everyone gets to this task, but would be worth it. Why don't they get there?
I affirm that it is time to do this task for several reasons:
Test stand
Let's start with simple, obvious cases. For clarity, I will use a test bench. This is a Golang application that gives http-200, or you can switch it to "give http-503" mode.
We start 3 instances:
We serve 100rps via yandex.tank via nginx.
Nginx out of the box:
At some point, turn on one of the backends in the give 503 mode, and we get exactly a third of the errors.
It is clear that nothing works out of the box: nginx does not retry out of the box if it received any response from the server .
In fact, this is quite logical from the side of nginx developers: nginx does not have the right to decide for you what you want to retray and what not.
Accordingly, we need retries - retries, and we begin to talk about them.
Retries
It is necessary to find a compromise between:
The truth, as usual, is somewhere between - we are forced to balance between these three points. Let's try to understand what and how.
I divided the unsuccessful attempts into 3 categories:
1. Transport error
For HTTP, transport is TCP, and, as a rule, here we talk about connection setup errors and connection setup timeouts. In my report, I will mention 3 common balancers (we'll talk about Envoy a little further):
У nginx есть возможность сказать, что неудачная попытка — это ошибка соединения и таймаут соединения; у HAProxy есть таймаут соединения, у Envoy тоже — все стандартно и нормально.
2. Request timeout:
Допустим, что мы отправили запрос на сервер, успешно с ним соединились, но ответ нам не приходит, мы его подождали и понимаем, что дальше ждать уже нет никакого смысла. Это называется request timeout:
3. HTTP status
All balancers, except for HAProxy, can handle it, if after all the backend answered you, but with some kind of erroneous code.
Timeouts
Now let's talk in detail about timeouts, it seems to me that it is worth paying attention to this. There will be no further rocket science - this is simply structured information about what generally happens and how it relates to it.
Connect timeout
Connect timeout is the time to establish a connection. This is a characteristic of your network and your specific server, and does not depend on the request. Usually, the default value for connect timeout is set to small. In all proxies, the default value is large enough, and this is wrong - it should be units, sometimes tens of milliseconds (if we are talking about a network within one DC).
If you want to identify problematic servers a little faster than these units-tens of milliseconds, you can adjust the load on the backend by setting a small backlog to receive TCP connections. In this case, you can, when the backlog of the application is full, tell Linux to reset it to overflow the backlog. Then you will be able to shoot the "bad" overloaded backend a little earlier than connect timeout:
Request timeout
Request timeout is not a network characteristic, but a characteristic of a group of requests (handler). There are different requests - they are different in severity, they have completely different logic inside, they need to access completely different repositories.
Nginx itself does not have a timeout for the entire request. He has:
That is, if you have a backend slowly, one byte of times, gives something in a timeout, then everything is fine. As such, nginx does not have request_timeout. But we are talking about upstream. In our data center they are controlled by us, therefore, assuming that the network does not have slow loris, then, in principle, read_timeout can be used as request_timeout.
Envoy has it all: timeout || per_try_timeout.
Select request timeout
Now the most important thing, in my opinion, is which request_timeout to put. We proceed from how much it is permissible for the user to wait - this is a certain maximum. It is clear that the user will not wait longer than 10 s, so you need to answer him faster.
There are different approaches, but in general, choosing a timeout is difficult . There will always be boundary cases, for example, the same handler in 99% of cases is processed in 10 ms, but there are 1% of cases when we wait for 500 ms, and this is normal. This will have to be resolved.
With this 1%, something needs to be done, because the entire group of requests should, for example, comply with the SLA and fit in 100 ms. Very often at these moments the application is processed:
Here we need to make a decision, which is not very simple from a psychological point of view, that if we do not have time to answer the user in the allotted time, we will give an error (it’s like in an ancient Chinese saying: “If the mare is dead, get off!”) .
After that, the process of monitoring your service from the point of view of the user is simplified:
Speculative retries # nifig
We made sure that choosing a timeout value is quite difficult. As you know, in order to simplify something, you need to complicate something :)
Speculative retray is a repeated request to another server, which is launched by some condition, but the first request is not interrupted. We take the answer from the server that answered faster.
I did not see this feature in balancers known to me, but there is an excellent example with Cassandra (rapid read protection):
speculative_retry = N ms | M th percentile
This way you don't have to time out . You can leave it at an acceptable level and in any case have a second attempt to get a response to the request.
Cassandra has an interesting opportunity to set a static speculative_retry or dynamic, then the second attempt will be made through the percentile of the response time. Cassandra accumulates statistics on the response times of previous requests and adapts a specific timeout value. This works pretty well.
In this approach, everything rests on the balance between reliability and spurious load. Not servers. You provide reliability, but sometimes you get extra requests to the server. If you were in a hurry somewhere and sent a second request, but the first one still answered, the server received a little more load. In a single case, this is a small problem.
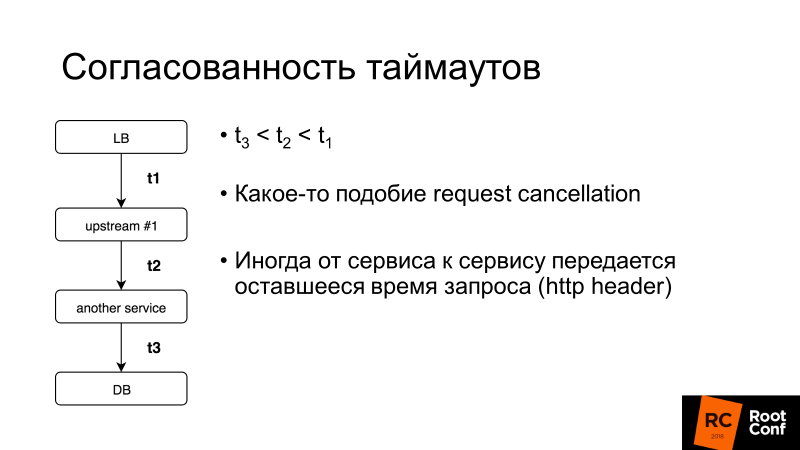
Timeout consistency is another important aspect. We’ll talk more about request cancellation, but in general, if the timeout for the entire user request is 100 ms, then it makes no sense to set the timeout for the request in the database for 1 s. There are systems that allow you to do this dynamically: service to service transfers the remainder of the time that you will wait for an answer to this request. It's complicated, but if you suddenly need it, you can easily find out how to do it in the same Envoy.
What else do you need to know about retry?
Point of no return (V1)
Here V1 is not version 1. In aviation there is such a concept - speed V1. This is the speed after which it is impossible to slow down on acceleration on the runway. It is necessary to take off, and then make a decision about what to do next.
The same point of no return is in the load balancers: when you passed 1 byte of the response to your client, no errors can be fixed . If the backend dies at this point, no retries will help. You can only reduce the likelihood of such a scenario being triggered, make a graceful shutdown, that is, tell your application: “You do not accept new requests now, but modify the old ones!” And only then extinguish it.
If you control the client, this is some tricky Ajax or mobile application, it may try to repeat the request, and then you can get out of this situation.
Point of No Return [Envoy]
Envoy had such a strange trick. There is per_try_timeout - it limits how much each attempt to get a response to a request can take. If this timeout worked, but the backend already started responding to the client, then everything was interrupted, the client received an error.
My colleague Pavel Trukhanov ( tru_pablo ) made a patch , which is already in master Envoy and will be in 1.7. Now it works as it should: if the response has begun to be transmitted, only the global timeout will work.
Retries: need to limit
Retries is good, but there are so-called killer requests: heavy requests that perform very complex logic access the database a lot and often do not fit per_try_timeout. If we send retry again and again, then we kill our base. Because in most (99.9%) database services there is no request cancellation .
Request cancellation means that the client has unhooked, you need to stop all work right now. Golang is actively promoting this approach, but unfortunately it ends with a backend, and many database repositories do not support this.
Accordingly, retries need to be limited, which allows almost all balancers (we stop considering HAProxy from now on).
Nginx:
Envoy:
In Nginx, we can say that we are trying to do retries throughout window X, that is, at a given time interval, for example, 500 ms, we do as many retries as fit. Or there is a setting that limits the number of repeated samples. In Envoy , the same is quantity or timeout (global).
Retries: apply [nginx]
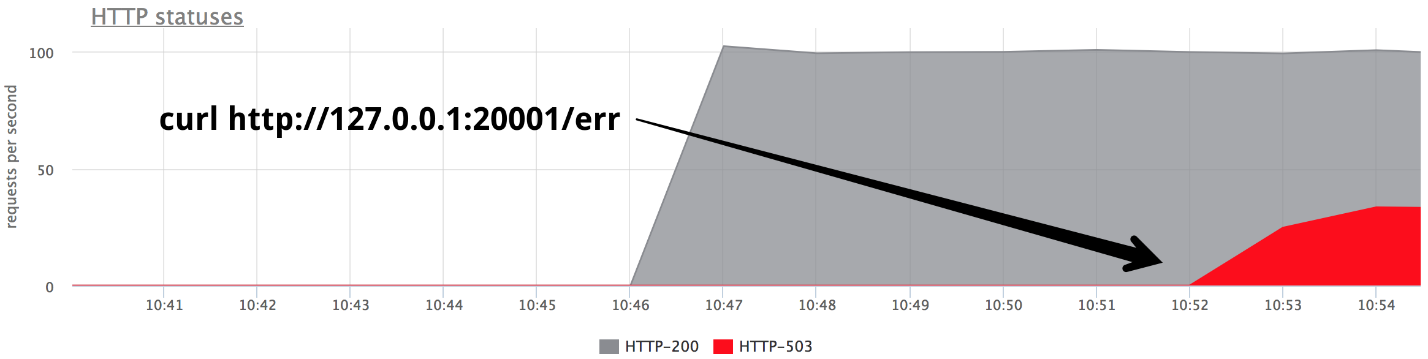
Consider an example: we set retry attempts in nginx 2 - accordingly, having received HTTP 503, we try to send a request to the server again. Then turn off the two backends.
Below are the graphs of our test bench. There are no errors on the upper graph, because there are very few of them. If you leave only errors, it is clear that they are.

What happened
But there are mistakes, and this does not suit us.
What to do about it?
We can either increase the number of retries (but then we return to the problem of “killer requests”), or we can reduce the likelihood of a request getting to “dead” backends. This can be done with health checks.
Health checks
I suggest considering health checks as an optimization of the process of choosing a “live” server. This in no way gives any guarantees. Accordingly, during the execution of a user request, we are more likely to get to only “live” servers. The balancer regularly accesses a specific URL, the server answers him: "I am alive and ready."
Health checks: in terms of backend
From the backend point of view, you can do interesting things:
Health checks: implementations
As a rule, everything here is all the same for everyone:
Nginx implements Health check functions only in the paid version of nginx +.
I note a feature of Envoy , it has a Health check panic mode. When we banned, as "unhealthy", more than N% of hosts (say 70%), he believes that all of our Health checks are lying, and all hosts are actually alive. In a very bad case, this will help you not run into a situation where you yourself shot your leg and banned all servers. This is a way to be safe again.
Putting it all together
Usually for Health checks set:
In our country, there is a tendency to set nginx + HAProxy, because the free version of nginx does not have health checks, and until 1.11.5 there was no limit on the number of connections to the backend. But this option is bad because HAProxy does not know how to retire after establishing a connection. Many people think that if HAProxy returns an error on nginx and nginx retries, then everything will be fine. Not really. You can get to another HAProxy and the same backend, because the backend pools are the same. So you introduce one more level of abstraction for yourself, which reduces the accuracy of your balancing and, accordingly, the availability of the service.
We have nginx + Envoy, but if you get confused, you can limit yourself to Envoy only.
What kind of Envoy?
Envoy is a trendy youth load balancer, originally developed in Lyft, written in C ++. Out of the box he can do a bunch of buns on our topic today. You probably saw it as a Service Mesh for Kubernetes. As a rule, Envoy acts as a data plane, that is, it directly balances traffic, and there is also a control plane that provides information on what you need to distribute the load between (service discovery, etc.).
I'll tell you a few words about his buns.
To increase the likelihood of a successful retry response the next time you try, you can sleep a bit and wait for the backends to come to their senses. This way we will handle short database problems. Envoy has a backoff for retries - pauses between retries. Moreover, the delay interval between attempts increases exponentially. The first retry occurs after 0-24 ms, the second after 0-74 ms, and then for each subsequent attempt the interval increases, and the specific delay is randomly selected from this interval.
The second approach is not Envoy-specific, but a pattern called Circuit breaking (lit. circuit breaker or fuse). When our backend dulls, in fact we try to finish it every time. This is because users in any incomprehensible situation click on the refresh-at page, sending you more and more new requests. Your balancers get nervous, send retries, the number of requests increases - the load is growing, and in this situation it would be nice not to send requests.
Circuit breaker just allows you to determine that we are in this state, quickly shoot the error and give the backends "catch their breath."
Circuit breaker (hystrix like libs), original on ebay's blog.
Above is the Hystrix Circuit breaker circuit. Hystrix is Netflix's Java library that is designed to implement fault tolerance patterns.
In Envoy, as such, this is not all. There are upper-level limits on the fact that there cannot be more than N requests for a specific upstream group. If more, something is wrong here - we return an error. There can be no more N active retries (i.e. retries that are happening right now).
You did not have retries, something exploded - send retries. Envoy understands that more than N is abnormal, and all requests must be shot with an error.
Circuit breaking [Envoy]
This simple thing works well, it is configurable, you don’t have to come up with special parameters, and the default settings are pretty good.
Circuit breaker: our experience
We used to have an HTTP metric collector, that is, agents installed on our clients' servers sent metrics to our cloud via HTTP. If we have any problems in the infrastructure, the agent writes the metrics to his disk and then tries to send them to us.
And agents constantly make attempts to send data to us, they are not upset that we somehow respond incorrectly, and do not leave.
If, after recovery, we start up the full flow of requests (besides, the load will be even more than usual, since we have added the accumulated metrics) to the servers, most likely everything will fall back on again, as some components will end up with a cold cache or something.
To deal with such a problem, we clamped the input stream of the record through nginx limit req. That is, we say that now we are processing, say, 200 RPS. When all this came to normal, we removed the restriction, because in a normal situation, the collector is able to record much more than the crisis limit req.
Then, for some reason, we switched to our protocol over TCP and lost the HTTP proxy buns (the ability to use nginx limit req). And in any case it was necessary to put this site in order. We no longer wanted to change the limit req by hand.
We have a rather convenient case, because we control both the client and the server. Therefore we are in the agentCircuit breaker, who understood that if he got N errors in a row, he needs to sleep, and after some time, and exponentially increasing, try again. When everything normalizes, he adds all the metrics, since he has a spool on the disk.
On the server, we added a Circuit breaker code of all calls to all subsystems + request cancellation (where possible). Thus, if we received N errors from Cassandra, N errors from Elastic, from the database, from a neighboring service - from anything, we quickly give an error and do not execute further logic. Just shoot off the error and that's it - wait until it normalizes.
The graphs above show that we do not get a burst of errors with problems (conditionally: gray is “two hundred”, red is “five hundred”). It can be seen that at the time of problems from 800 RPS 20-30 flew to the backend. This allowed our backend to catch its breath, rise, and continue to work well.
The most difficult mistakes
The most difficult errors are those that are ambiguous.
If your server just turned off and does not turn on, or you realized that it was dead and finished it off yourself - this is actually a gift of fate. This option is well formalized.
It is much worse when one server starts to behave unpredictably, for example, the server responds with all errors, and HTTP 200 with Health checks.
Let me give you a real life example.
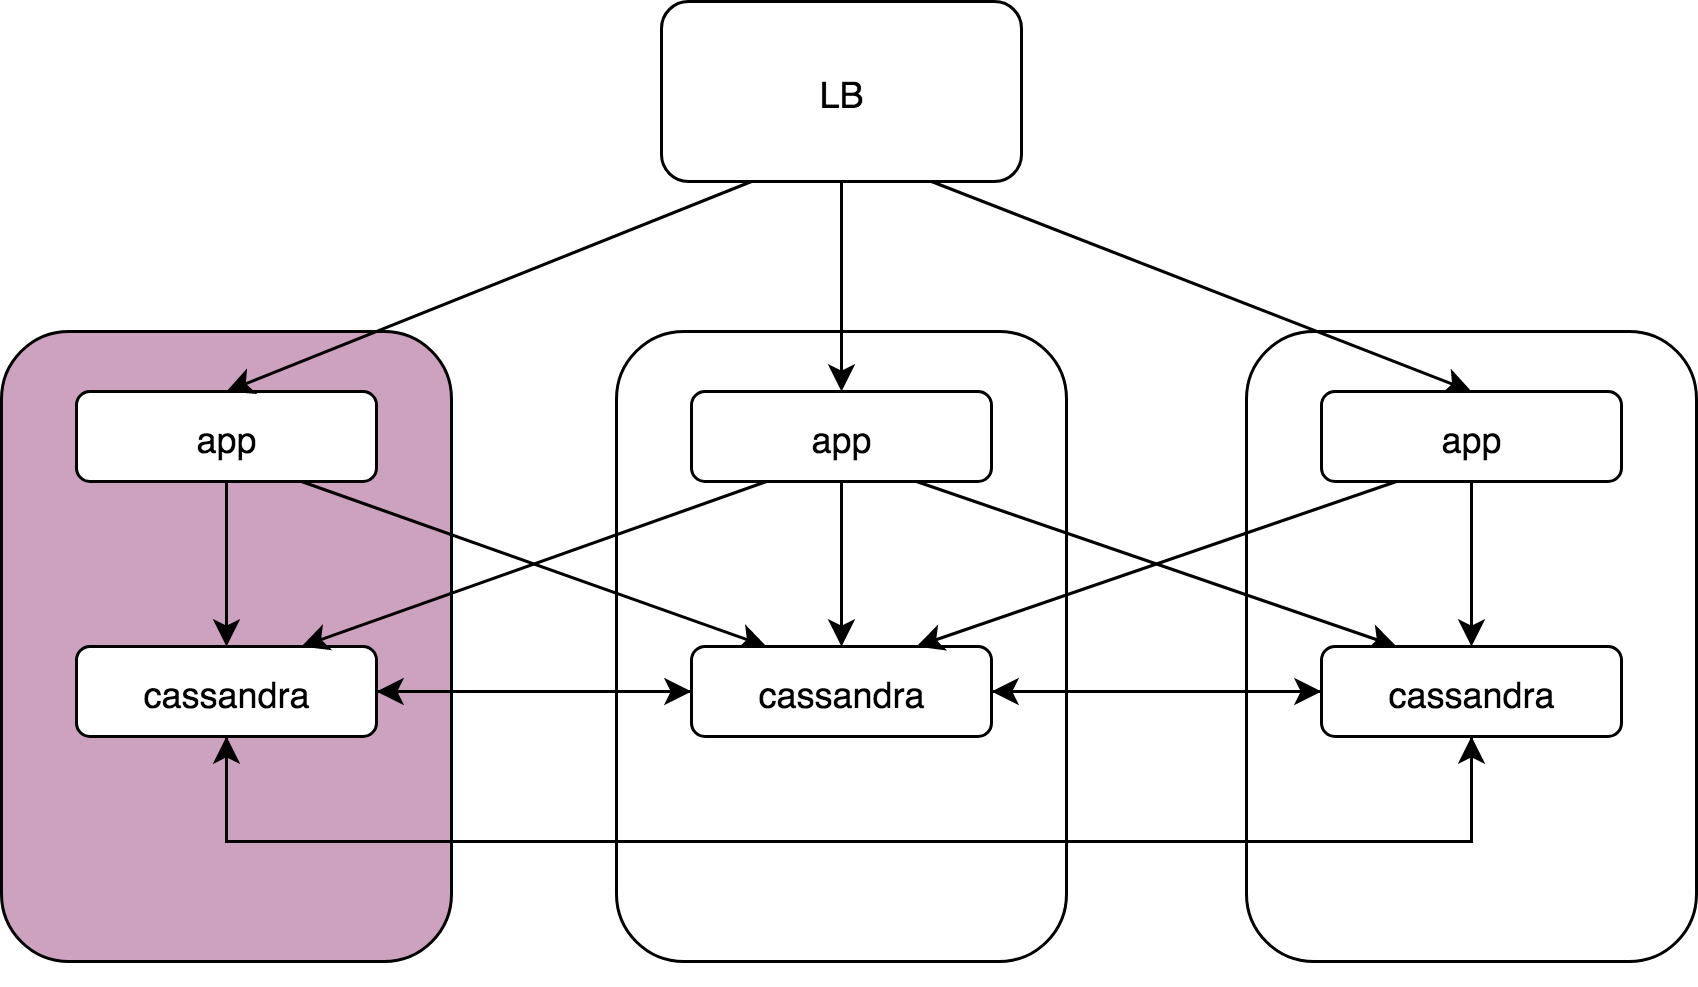
We have a certain Load Balancer, 3 nodes, on each of which there is an application and under it Cassandra. Applications access all instances of Cassandra, and all Cassandra interact with their neighbors, because Cassandra has a two-level model, coordinator and data noda.
The Schrödinger server is one of them in its entirety:kernel: NETDEV WATCHDOG: eth0 (ixgbe): transmit queue 3 timed out.
The following happened there: in the network driver, a bug (in Intel drivers they happen), and one of the 64 transmission queues simply stopped sending. Accordingly, 1/64 of all traffic is lost. This can happen before reboot, it is not treated in any way.
I, as an administrator, care about this situation, why not such bugs in the driver. I care about why, when you build a system without a single point of failure, problems on one server ultimately lead to the failure of the whole production. I was wondering how this can be resolved, and on the machine. I do not want to wake up at night to turn off the server.
Cassandra: coordinator -> nodes
In Cassandra, there are those very speculative retries, and this situation is worked out very easily. There is a slight increase in latency at 99 percentile, but it is not fatal and in general everything works.
App -> cassandra coordinator
Nothing works out of the box. When the application knocks on Cassandra and gets to the coordinator on the "dead" server, it doesn’t work out in any way, errors, latency growth, etc. are obtained.
In fact, we use gocql - a rather sophisticated cassandra client. We just did not use all its features. There is a HostSelectionPolicy, in which we can slip the bitly / go-hostpool library . It uses Epsilon greedy algorithms to find and remove outliers from the list.
I’ll try to briefly explain how the Epsilon-greedy algorithm works .
There is the problem of a multi-armed bandit: you are in a room with slot machines, you have several coins, and you must win as many attempts as you can in N attempts.
The algorithm includes two stages:
Accordingly, a small number of requests (10 - 30%) are sent to round - robin simply to all hosts, we consider failures, response time, we select the best. Then we send 70 - 90% of requests to the best and update our statistics.
Each server estimates the host-pool by the number of successful responses and response time. That is, he takes the fastest server in the end. He calculates the response time as a weighted average (fresh measurements are more significant - what was right now is much more significant). Therefore, we periodically reset old measurements. So with a good probability, our server, which returns errors or is stupid, leaves, and requests for it practically stop coming to it.
We added "armor-piercing" (fault tolerance) at the application level — Cassandra and Cassandra coordinator-data. But if our balancer (nginx, Envoy - whatever) sends requests for a “bad” Application, which, turning to any Cassandra, will stupid, because the grid itself is not working, we will get problems anyway.
In Envoy out of the box there is Outlier detection by:
By consecutive "five hundred" you can understand that something is wrong with the server, and ban it. But not forever, but for a time interval. Then a small number of requests begins to arrive there - if it is stupid again, we ban it, but for a longer interval. Thus, it all boils down to the fact that virtually no requests get to this problem server.
On the other hand, in order to protect ourselves from the uncontrolled explosion of this “intelligence”, we have max_ejection_percent. This is the maximum number of hosts that we can count as outlier, as a percentage of all available. That is, if we banned 70% of the hosts — this does not count, we unban everyone — in short, an amnesty!
This very cool thing works great, while it is simple and straightforward - I advise!
TOTAL
I hope I convinced you that you need to deal with such cases. I believe that the fight against outliers and latency is definitely worth it in order to:
Obviously nothing works out of the box , accept this fact. This is normal, because there are so many decisions that you need to make yourself, and the software cannot do this for you - it waits for you to configure it.
No need to chase the most sophisticated balancer . For 99% of the problems, the standard features of nginx /HAProxy / Envoy are enough . A more sophisticated proxy will be needed if you want to do everything absolutely perfectly and remove the “five hundred” micro solders.
It's not about the specific proxy (if it's not HAProxy :)), but about how you configured it.
The small minute peak at 84 RPS of “five hundred” is five thousand errors that real users received. This is a lot and it is very important. It is necessary to look for reasons, work on errors and try to continue to prevent such situations.
Nikolay Sivko ( NikolaySivko ) in his report on RootConf 2018 talked about the subtle and not yet very popular aspects of load balancing:
- when to repeat the request (retries);
- how to select values for timeouts;
- how not to kill the underlying servers at the time of the accident / congestion;
- whether health checks are needed;
- how to handle flickering problems.
Under cat decoding of this report.
About the speaker: Nikolay Sivko co-founder of okmeter.io. He worked as a system administrator and the leader of a group of administrators. Supervised operation at hh.ru. He founded the monitoring service okmeter.io. As part of this report, monitoring development experience is the main source of cases.
What are we going to talk about?
This article will talk about web projects. Below is an example of live production: the graph shows requests per second for a certain web service.
When I talk about balancing, many perceive it as "we need to distribute the load between the servers - the more accurate, the better."
In fact this is not true. This problem is relevant for a very small number of companies. More often business is worried about errors and system stability.
The small peak on the graph is “five hundred”, which the server returned within a minute, and then stopped. From the point of view of a business, such as an online store, this small peak at 84 RPS of “five hundred” is 5040 errors to real users. Some did not find something in your catalog, others could not put the goods in the basket. And this is very important. Although this peak does not look very large on the chart, it is a lot in real users .
As a rule, everyone has such peaks, and admins do not always respond to them. Very often, when a business asks what it was, they answer him:
- “This is a short burst!”
- “It's just a release rolling.”
- "The server is dead, but everything is already in order."
- "Vasya switched the network of one of the backends."
Often people do not even try to understand the reasons why this happened, and do not do any post-work so that it does not happen again.
Fine tune
I called the report “Fine tuning” (Eng. Fine tuning), because I thought that not everyone gets to this task, but would be worth it. Why don't they get there?
- Not everyone gets to this task, because when everything works, it is not visible. This is very important for problems. Fakapa does not happen every day, and such a small problem requires very serious efforts in order to resolve it.
- You need to think a lot. Very often, the admin - the person who adjusts the balance - is not able to independently solve this problem. Next we will see why.
- It catches the underlying levels. This task is very closely connected with the development, with the adoption of decisions that affect your product and your users.
I affirm that it is time to do this task for several reasons:
- The world is changing, becoming more dynamic, there are many releases. They say that now it’s correct to release 100 times a day, and the release is the future fakap with a probability of 50 to 50 (just like the probability of meeting a dinosaur)
- From the point of view of technology, everything is also very dynamic. Kubernetes and other orchestrators appeared. There is no good old deployment, when one backend on some IP is turned off, an update is rolled, and the service goes up. Now in the process of rollout in k8s the list of IP upstream is completely changing.
- Microservices: now everyone communicates over the network, which means that you need to do this reliably. Balancing plays an important role.
Test stand
Let's start with simple, obvious cases. For clarity, I will use a test bench. This is a Golang application that gives http-200, or you can switch it to "give http-503" mode.
We start 3 instances:
- 127.0.0.1:20001
- 127.0.0.1:20002
- 127.0.0.1:20003
We serve 100rps via yandex.tank via nginx.
Nginx out of the box:
upstream backends {
  server 127.0.0.1:20001;
  server 127.0.0.1:20002;
  server 127.0.0.1:20003;
}
server {
  listen 127.0.0.1:30000;
  location / {
    proxy_pass http://backends;
  }
}
Primitive scenario
At some point, turn on one of the backends in the give 503 mode, and we get exactly a third of the errors.
It is clear that nothing works out of the box: nginx does not retry out of the box if it received any response from the server .
Nginx default: proxy_next_upstream error timeout;
In fact, this is quite logical from the side of nginx developers: nginx does not have the right to decide for you what you want to retray and what not.
Accordingly, we need retries - retries, and we begin to talk about them.
Retries
It is necessary to find a compromise between:
- The user request is holy, get hurt, but answer. We want to answer the user at all costs, the user is the most important.
- Better to answer with an error than overloading the servers.
- Data integrity (for non-idempotent requests), i.e. it is impossible to repeat certain types of requests.
The truth, as usual, is somewhere between - we are forced to balance between these three points. Let's try to understand what and how.
I divided the unsuccessful attempts into 3 categories:
1. Transport error
For HTTP, transport is TCP, and, as a rule, here we talk about connection setup errors and connection setup timeouts. In my report, I will mention 3 common balancers (we'll talk about Envoy a little further):
- nginx : errors + timeout (proxy_connect_timeout);
- HAProxy : timeout connect;
- Envoy : connect-failure + refused-stream.
У nginx есть возможность сказать, что неудачная попытка — это ошибка соединения и таймаут соединения; у HAProxy есть таймаут соединения, у Envoy тоже — все стандартно и нормально.
2. Request timeout:
Допустим, что мы отправили запрос на сервер, успешно с ним соединились, но ответ нам не приходит, мы его подождали и понимаем, что дальше ждать уже нет никакого смысла. Это называется request timeout:
- У nginx есть: timeout (prox_send_timeout* + proxy_read_timeout*);
- У HAProxy — OOPS :( — его в принципе нет. Многие не знают, что HAProxy, если успешно установил соединение, никогда не будет пробовать повторно послать запрос.
- Envoy все умеет: timeout || per_try_timeout.
3. HTTP status
All balancers, except for HAProxy, can handle it, if after all the backend answered you, but with some kind of erroneous code.
- nginx : http_ *
- HAProxy : OOPS :(
- Envoy : 5xx, gateway-error (502, 503, 504), retriable-4xx (409)
Timeouts
Now let's talk in detail about timeouts, it seems to me that it is worth paying attention to this. There will be no further rocket science - this is simply structured information about what generally happens and how it relates to it.
Connect timeout
Connect timeout is the time to establish a connection. This is a characteristic of your network and your specific server, and does not depend on the request. Usually, the default value for connect timeout is set to small. In all proxies, the default value is large enough, and this is wrong - it should be units, sometimes tens of milliseconds (if we are talking about a network within one DC).
If you want to identify problematic servers a little faster than these units-tens of milliseconds, you can adjust the load on the backend by setting a small backlog to receive TCP connections. In this case, you can, when the backlog of the application is full, tell Linux to reset it to overflow the backlog. Then you will be able to shoot the "bad" overloaded backend a little earlier than connect timeout:
fail fast: listen backlog + net.ipv4.tcp_abort_on_overflowRequest timeout
Request timeout is not a network characteristic, but a characteristic of a group of requests (handler). There are different requests - they are different in severity, they have completely different logic inside, they need to access completely different repositories.
Nginx itself does not have a timeout for the entire request. He has:
- proxy_send_timeout: time between two successful write operations write ();
- proxy_read_timeout: time between two successful read reads ().
That is, if you have a backend slowly, one byte of times, gives something in a timeout, then everything is fine. As such, nginx does not have request_timeout. But we are talking about upstream. In our data center they are controlled by us, therefore, assuming that the network does not have slow loris, then, in principle, read_timeout can be used as request_timeout.
Envoy has it all: timeout || per_try_timeout.
Select request timeout
Now the most important thing, in my opinion, is which request_timeout to put. We proceed from how much it is permissible for the user to wait - this is a certain maximum. It is clear that the user will not wait longer than 10 s, so you need to answer him faster.
- If we want to handle the failure of one single server, then the timeout should be less than the maximum allowable timeout: request_timeout <max.
- If you want to have 2 guaranteed attempts to send a request to two different backends, then the timeout for one attempt is equal to half of this allowable interval: per_try_timeout = 0.5 * max.
- There is also an intermediate option - 2 optimistic attempts in case the first backend has "dulled", but the second will respond quickly: per_try_timeout = k * max (where k> 0.5).
There are different approaches, but in general, choosing a timeout is difficult . There will always be boundary cases, for example, the same handler in 99% of cases is processed in 10 ms, but there are 1% of cases when we wait for 500 ms, and this is normal. This will have to be resolved.
With this 1%, something needs to be done, because the entire group of requests should, for example, comply with the SLA and fit in 100 ms. Very often at these moments the application is processed:
- Paging appears in those places where it is impossible to return all the data in a timeout.
- The admin / reports are separated into a separate group of urls in order to increase the timeout for them, and yes to lower user requests.
- We repair / optimize those requests that do not fit into our timeout.
Here we need to make a decision, which is not very simple from a psychological point of view, that if we do not have time to answer the user in the allotted time, we will give an error (it’s like in an ancient Chinese saying: “If the mare is dead, get off!”) .
After that, the process of monitoring your service from the point of view of the user is simplified:
- If there are errors, everything is bad, it needs to be fixed.
- If there are no errors, we fit into the right response time, then everything is fine.
Speculative retries # nifig
We made sure that choosing a timeout value is quite difficult. As you know, in order to simplify something, you need to complicate something :)
Speculative retray is a repeated request to another server, which is launched by some condition, but the first request is not interrupted. We take the answer from the server that answered faster.
I did not see this feature in balancers known to me, but there is an excellent example with Cassandra (rapid read protection):
speculative_retry = N ms | M th percentile
This way you don't have to time out . You can leave it at an acceptable level and in any case have a second attempt to get a response to the request.
Cassandra has an interesting opportunity to set a static speculative_retry or dynamic, then the second attempt will be made through the percentile of the response time. Cassandra accumulates statistics on the response times of previous requests and adapts a specific timeout value. This works pretty well.
In this approach, everything rests on the balance between reliability and spurious load. Not servers. You provide reliability, but sometimes you get extra requests to the server. If you were in a hurry somewhere and sent a second request, but the first one still answered, the server received a little more load. In a single case, this is a small problem.
Timeout consistency is another important aspect. We’ll talk more about request cancellation, but in general, if the timeout for the entire user request is 100 ms, then it makes no sense to set the timeout for the request in the database for 1 s. There are systems that allow you to do this dynamically: service to service transfers the remainder of the time that you will wait for an answer to this request. It's complicated, but if you suddenly need it, you can easily find out how to do it in the same Envoy.
What else do you need to know about retry?
Point of no return (V1)
Here V1 is not version 1. In aviation there is such a concept - speed V1. This is the speed after which it is impossible to slow down on acceleration on the runway. It is necessary to take off, and then make a decision about what to do next.
The same point of no return is in the load balancers: when you passed 1 byte of the response to your client, no errors can be fixed . If the backend dies at this point, no retries will help. You can only reduce the likelihood of such a scenario being triggered, make a graceful shutdown, that is, tell your application: “You do not accept new requests now, but modify the old ones!” And only then extinguish it.
If you control the client, this is some tricky Ajax or mobile application, it may try to repeat the request, and then you can get out of this situation.
Point of No Return [Envoy]
Envoy had such a strange trick. There is per_try_timeout - it limits how much each attempt to get a response to a request can take. If this timeout worked, but the backend already started responding to the client, then everything was interrupted, the client received an error.
My colleague Pavel Trukhanov ( tru_pablo ) made a patch , which is already in master Envoy and will be in 1.7. Now it works as it should: if the response has begun to be transmitted, only the global timeout will work.
Retries: need to limit
Retries is good, but there are so-called killer requests: heavy requests that perform very complex logic access the database a lot and often do not fit per_try_timeout. If we send retry again and again, then we kill our base. Because in most (99.9%) database services there is no request cancellation .
Request cancellation means that the client has unhooked, you need to stop all work right now. Golang is actively promoting this approach, but unfortunately it ends with a backend, and many database repositories do not support this.
Accordingly, retries need to be limited, which allows almost all balancers (we stop considering HAProxy from now on).
Nginx:
- proxy_next_upstream_timeout (global)
- proxt_read_timeout ** as per_try_timeout
- proxy_next_upstream_tries
Envoy:
- timeout (global)
- per_try_timeout
- num_retries
In Nginx, we can say that we are trying to do retries throughout window X, that is, at a given time interval, for example, 500 ms, we do as many retries as fit. Or there is a setting that limits the number of repeated samples. In Envoy , the same is quantity or timeout (global).
Retries: apply [nginx]
Consider an example: we set retry attempts in nginx 2 - accordingly, having received HTTP 503, we try to send a request to the server again. Then turn off the two backends.
upstream backends {
  server 127.0.0.1:20001;
  server 127.0.0.1:20002;
  server 127.0.0.1:20003;
}
server {
  listen 127.0.0.1:30000;
proxy_next_upstream error timeout http_503;
proxy_next_upstream_tries 2;
  location / {
    proxy_pass http://backends;
  }
}
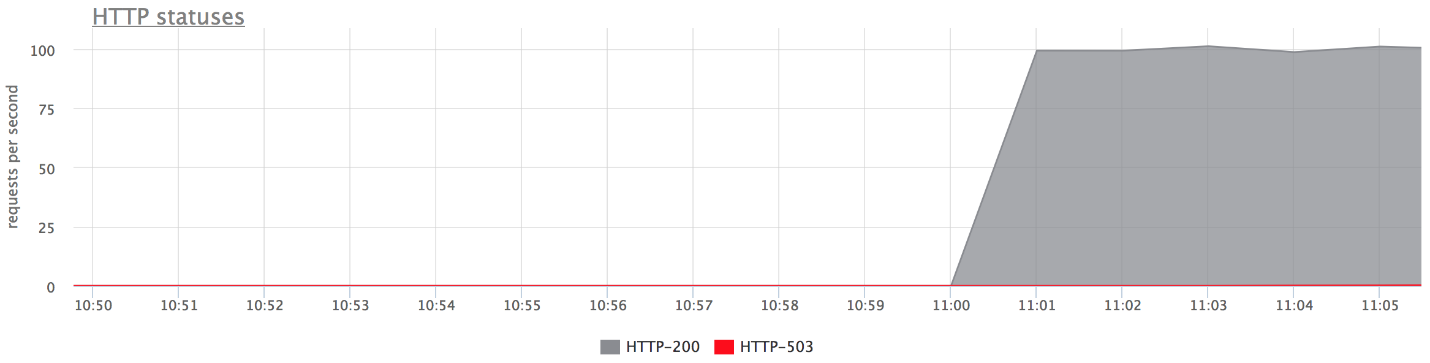
Below are the graphs of our test bench. There are no errors on the upper graph, because there are very few of them. If you leave only errors, it is clear that they are.
What happened
- proxy_next_upstream_tries = 2.
- In the case when you make the first attempt to the "dead" server, and the second - to the other "dead", you get HTTP-503 in case of both attempts to the "bad" servers.
- There are few errors, since nginx "bans" a bad server. That is, if in nginx some errors have returned from the backend, it stops making the following attempts to send a request to it. This is governed by the fail_timeout variable .
But there are mistakes, and this does not suit us.
What to do about it?
We can either increase the number of retries (but then we return to the problem of “killer requests”), or we can reduce the likelihood of a request getting to “dead” backends. This can be done with health checks.
Health checks
I suggest considering health checks as an optimization of the process of choosing a “live” server. This in no way gives any guarantees. Accordingly, during the execution of a user request, we are more likely to get to only “live” servers. The balancer regularly accesses a specific URL, the server answers him: "I am alive and ready."
Health checks: in terms of backend
From the backend point of view, you can do interesting things:
- Check the readiness for operation of all the underlying subsystems on which the backend operation depends: the necessary number of connections to the database is established, the pool has free connections, etc., etc.
- You can hang your own logic on the Health checks URL if the balancer used is not very intelligent (for example, you take the Load Balancer from the host). The server can remember that “in the last minute I gave so many errors - I’m probably some kind of“ wrong ”server, and for the next 2 minutes I will respond with“ five hundred ”to Health checks. Thus I’ll ban myself! ” This sometimes helps a lot when you have an uncontrolled Load Balancer.
- Typically, the check interval is about a second, and you need the Health check handler not to kill your server. It should be light.
Health checks: implementations
As a rule, everything here is all the same for everyone:
- Request;
- Timeout on it;
- Interval, через который мы делаем проверки. У навороченных прокси есть jitter, то есть некая рандомизация для того, чтобы все Health checks не приходили на бэкенд одномоментно, и не убивали его.
- Unhealthy threshold — порог, сколько должно пройти неудачных Health checks, чтобы сервис пометить, как Unhealthy.
- Healthy threshold — наоборот, сколько удачных попыток должно пройти, чтобы сервер вернуть в строй.
- Дополнительная логика. Вы можете разбирать Check status + body и пр.
Nginx implements Health check functions only in the paid version of nginx +.
I note a feature of Envoy , it has a Health check panic mode. When we banned, as "unhealthy", more than N% of hosts (say 70%), he believes that all of our Health checks are lying, and all hosts are actually alive. In a very bad case, this will help you not run into a situation where you yourself shot your leg and banned all servers. This is a way to be safe again.
Putting it all together
Usually for Health checks set:
- Or nginx +;
- Or nginx + something else :)
In our country, there is a tendency to set nginx + HAProxy, because the free version of nginx does not have health checks, and until 1.11.5 there was no limit on the number of connections to the backend. But this option is bad because HAProxy does not know how to retire after establishing a connection. Many people think that if HAProxy returns an error on nginx and nginx retries, then everything will be fine. Not really. You can get to another HAProxy and the same backend, because the backend pools are the same. So you introduce one more level of abstraction for yourself, which reduces the accuracy of your balancing and, accordingly, the availability of the service.
We have nginx + Envoy, but if you get confused, you can limit yourself to Envoy only.
What kind of Envoy?
Envoy is a trendy youth load balancer, originally developed in Lyft, written in C ++. Out of the box he can do a bunch of buns on our topic today. You probably saw it as a Service Mesh for Kubernetes. As a rule, Envoy acts as a data plane, that is, it directly balances traffic, and there is also a control plane that provides information on what you need to distribute the load between (service discovery, etc.).
I'll tell you a few words about his buns.
To increase the likelihood of a successful retry response the next time you try, you can sleep a bit and wait for the backends to come to their senses. This way we will handle short database problems. Envoy has a backoff for retries - pauses between retries. Moreover, the delay interval between attempts increases exponentially. The first retry occurs after 0-24 ms, the second after 0-74 ms, and then for each subsequent attempt the interval increases, and the specific delay is randomly selected from this interval.
The second approach is not Envoy-specific, but a pattern called Circuit breaking (lit. circuit breaker or fuse). When our backend dulls, in fact we try to finish it every time. This is because users in any incomprehensible situation click on the refresh-at page, sending you more and more new requests. Your balancers get nervous, send retries, the number of requests increases - the load is growing, and in this situation it would be nice not to send requests.
Circuit breaker just allows you to determine that we are in this state, quickly shoot the error and give the backends "catch their breath."
Circuit breaker (hystrix like libs), original on ebay's blog.
Above is the Hystrix Circuit breaker circuit. Hystrix is Netflix's Java library that is designed to implement fault tolerance patterns.
- The “fuse” can be in the “closed” state when all requests are sent to the backend and there are no errors.
- When a certain fail threshold is triggered, that is, some errors have occurred, the circuit breaker goes into the “Open” state. It quickly returns an error to the client, and requests do not get to the backend.
- Once in a certain period of time, still a small part of the requests are sent to the backend. If an error is triggered, the state remains “Open”. If everything starts to work well and respond, the “fuse” closes and work continues.
In Envoy, as such, this is not all. There are upper-level limits on the fact that there cannot be more than N requests for a specific upstream group. If more, something is wrong here - we return an error. There can be no more N active retries (i.e. retries that are happening right now).
You did not have retries, something exploded - send retries. Envoy understands that more than N is abnormal, and all requests must be shot with an error.
Circuit breaking [Envoy]
- Cluster (upstream group) max connections
- Cluster max pending requests
- Cluster max requests
- Cluster max active retries
This simple thing works well, it is configurable, you don’t have to come up with special parameters, and the default settings are pretty good.
Circuit breaker: our experience
We used to have an HTTP metric collector, that is, agents installed on our clients' servers sent metrics to our cloud via HTTP. If we have any problems in the infrastructure, the agent writes the metrics to his disk and then tries to send them to us.
And agents constantly make attempts to send data to us, they are not upset that we somehow respond incorrectly, and do not leave.
If, after recovery, we start up the full flow of requests (besides, the load will be even more than usual, since we have added the accumulated metrics) to the servers, most likely everything will fall back on again, as some components will end up with a cold cache or something.
To deal with such a problem, we clamped the input stream of the record through nginx limit req. That is, we say that now we are processing, say, 200 RPS. When all this came to normal, we removed the restriction, because in a normal situation, the collector is able to record much more than the crisis limit req.
Then, for some reason, we switched to our protocol over TCP and lost the HTTP proxy buns (the ability to use nginx limit req). And in any case it was necessary to put this site in order. We no longer wanted to change the limit req by hand.
We have a rather convenient case, because we control both the client and the server. Therefore we are in the agentCircuit breaker, who understood that if he got N errors in a row, he needs to sleep, and after some time, and exponentially increasing, try again. When everything normalizes, he adds all the metrics, since he has a spool on the disk.
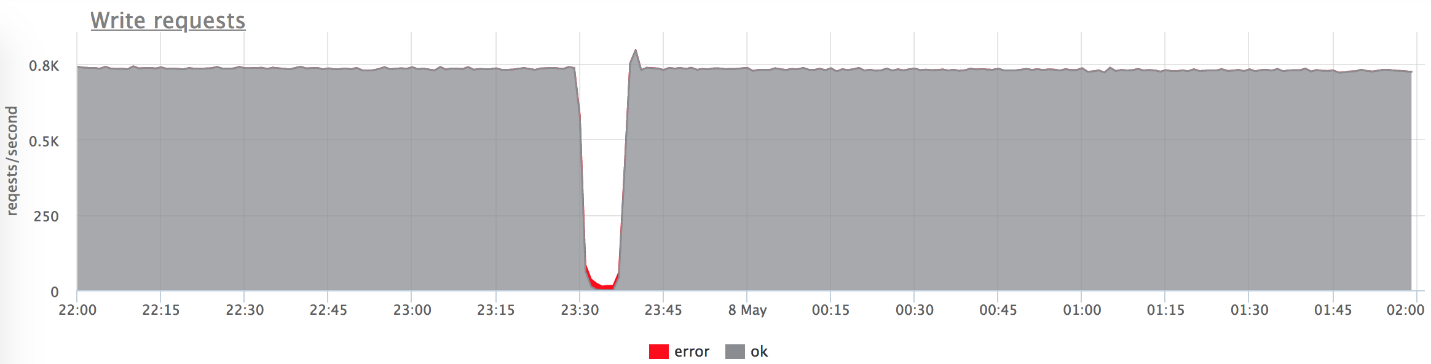
On the server, we added a Circuit breaker code of all calls to all subsystems + request cancellation (where possible). Thus, if we received N errors from Cassandra, N errors from Elastic, from the database, from a neighboring service - from anything, we quickly give an error and do not execute further logic. Just shoot off the error and that's it - wait until it normalizes.
The graphs above show that we do not get a burst of errors with problems (conditionally: gray is “two hundred”, red is “five hundred”). It can be seen that at the time of problems from 800 RPS 20-30 flew to the backend. This allowed our backend to catch its breath, rise, and continue to work well.
The most difficult mistakes
The most difficult errors are those that are ambiguous.
If your server just turned off and does not turn on, or you realized that it was dead and finished it off yourself - this is actually a gift of fate. This option is well formalized.
It is much worse when one server starts to behave unpredictably, for example, the server responds with all errors, and HTTP 200 with Health checks.
Let me give you a real life example.
We have a certain Load Balancer, 3 nodes, on each of which there is an application and under it Cassandra. Applications access all instances of Cassandra, and all Cassandra interact with their neighbors, because Cassandra has a two-level model, coordinator and data noda.
The Schrödinger server is one of them in its entirety:kernel: NETDEV WATCHDOG: eth0 (ixgbe): transmit queue 3 timed out.
The following happened there: in the network driver, a bug (in Intel drivers they happen), and one of the 64 transmission queues simply stopped sending. Accordingly, 1/64 of all traffic is lost. This can happen before reboot, it is not treated in any way.
I, as an administrator, care about this situation, why not such bugs in the driver. I care about why, when you build a system without a single point of failure, problems on one server ultimately lead to the failure of the whole production. I was wondering how this can be resolved, and on the machine. I do not want to wake up at night to turn off the server.
Cassandra: coordinator -> nodes
In Cassandra, there are those very speculative retries, and this situation is worked out very easily. There is a slight increase in latency at 99 percentile, but it is not fatal and in general everything works.
App -> cassandra coordinator
Nothing works out of the box. When the application knocks on Cassandra and gets to the coordinator on the "dead" server, it doesn’t work out in any way, errors, latency growth, etc. are obtained.
In fact, we use gocql - a rather sophisticated cassandra client. We just did not use all its features. There is a HostSelectionPolicy, in which we can slip the bitly / go-hostpool library . It uses Epsilon greedy algorithms to find and remove outliers from the list.
I’ll try to briefly explain how the Epsilon-greedy algorithm works .
There is the problem of a multi-armed bandit: you are in a room with slot machines, you have several coins, and you must win as many attempts as you can in N attempts.
The algorithm includes two stages:
- The “ explore” phase - when you research: spend 10 coins to determine which machine is better.
- The exploit phase - the remaining coins are lowered into the best machine.
Accordingly, a small number of requests (10 - 30%) are sent to round - robin simply to all hosts, we consider failures, response time, we select the best. Then we send 70 - 90% of requests to the best and update our statistics.
Each server estimates the host-pool by the number of successful responses and response time. That is, he takes the fastest server in the end. He calculates the response time as a weighted average (fresh measurements are more significant - what was right now is much more significant). Therefore, we periodically reset old measurements. So with a good probability, our server, which returns errors or is stupid, leaves, and requests for it practically stop coming to it.
Subtotal
We added "armor-piercing" (fault tolerance) at the application level — Cassandra and Cassandra coordinator-data. But if our balancer (nginx, Envoy - whatever) sends requests for a “bad” Application, which, turning to any Cassandra, will stupid, because the grid itself is not working, we will get problems anyway.
In Envoy out of the box there is Outlier detection by:
- Consecutive http-5xx.
- Consecutive gateway errors (502,503,504).
- Success rate.
By consecutive "five hundred" you can understand that something is wrong with the server, and ban it. But not forever, but for a time interval. Then a small number of requests begins to arrive there - if it is stupid again, we ban it, but for a longer interval. Thus, it all boils down to the fact that virtually no requests get to this problem server.
On the other hand, in order to protect ourselves from the uncontrolled explosion of this “intelligence”, we have max_ejection_percent. This is the maximum number of hosts that we can count as outlier, as a percentage of all available. That is, if we banned 70% of the hosts — this does not count, we unban everyone — in short, an amnesty!
This very cool thing works great, while it is simple and straightforward - I advise!
TOTAL
I hope I convinced you that you need to deal with such cases. I believe that the fight against outliers and latency is definitely worth it in order to:
- Do auto-deals, release the right number of times a day, etc.
- Sleep peacefully at night, do not jump up again by SMS, and fix problem servers during working hours.
Obviously nothing works out of the box , accept this fact. This is normal, because there are so many decisions that you need to make yourself, and the software cannot do this for you - it waits for you to configure it.
No need to chase the most sophisticated balancer . For 99% of the problems, the standard features of nginx /
It's not about the specific proxy (if it's not HAProxy :)), but about how you configured it.
At DevOpsConf Russia, Nikolay will talk about the experience of implementing Kubernetes, taking into account the resiliency and the need to save human resources. What else awaits us at the conference can be found in the Program .
If you want to receive program updates, new transcripts, and important conference news, subscribe to the Ontiko Thematic Newsletter on DevOps.
You like watching reports more than reading articles, go to the YouTube channel - there are all the operation videos for recent years and the list is constantly updated.