Splunk + Excel. What will happen?
- Tutorial
In previous articles, we talked a lot about Splunk . This is a product that allows you to collect and analyze data from any IT systems in real time, for example, it can be the results of a web server, mail server , Windows, various applications, etc. Does this mean that if all employees interested in analytics obtained in Splunk need to understand the work of the program, make changes to their business processes and do all analytics only in Splunk? Of course not!

In this article, we will show how to make sure that in a few clicks the sales department can receive a table in MS Excel with current data on the sale of goods through the online store.
At company X, data from various IT systems is indexed in Splunk, including data from the web store web server.
The sales department of company X needs to receive information about the sales volume of goods through the online store for the previous week for further analytics in MS Excel.
Thus, by installing and configuring the ODBC driver, you can download the results of any queries stored in Splunk into Excel in a few clicks. If necessary, carry out their filtering and sorting and obtain useful data for further analytics in Excel.
We are happy to answer all your questions and comments on this topic. Also, if you are interested in something specifically in this area, or in the field of machine data analysis in general, we are ready to finalize the existing solutions for you, for your specific task. To do this, you can write about it in the comments or simply send us a request through the form on our website .
In this article, we will show how to make sure that in a few clicks the sales department can receive a table in MS Excel with current data on the sale of goods through the online store.
Task
At company X, data from various IT systems is indexed in Splunk, including data from the web store web server.
The sales department of company X needs to receive information about the sales volume of goods through the online store for the previous week for further analytics in MS Excel.
Implementation
Create a request in Splunk
Which will give us the necessary table with the results. And save the table as a report: “Save As” - “Report” .
Download ODBC driver
It can be downloaded from the SplunkBase website at the following link .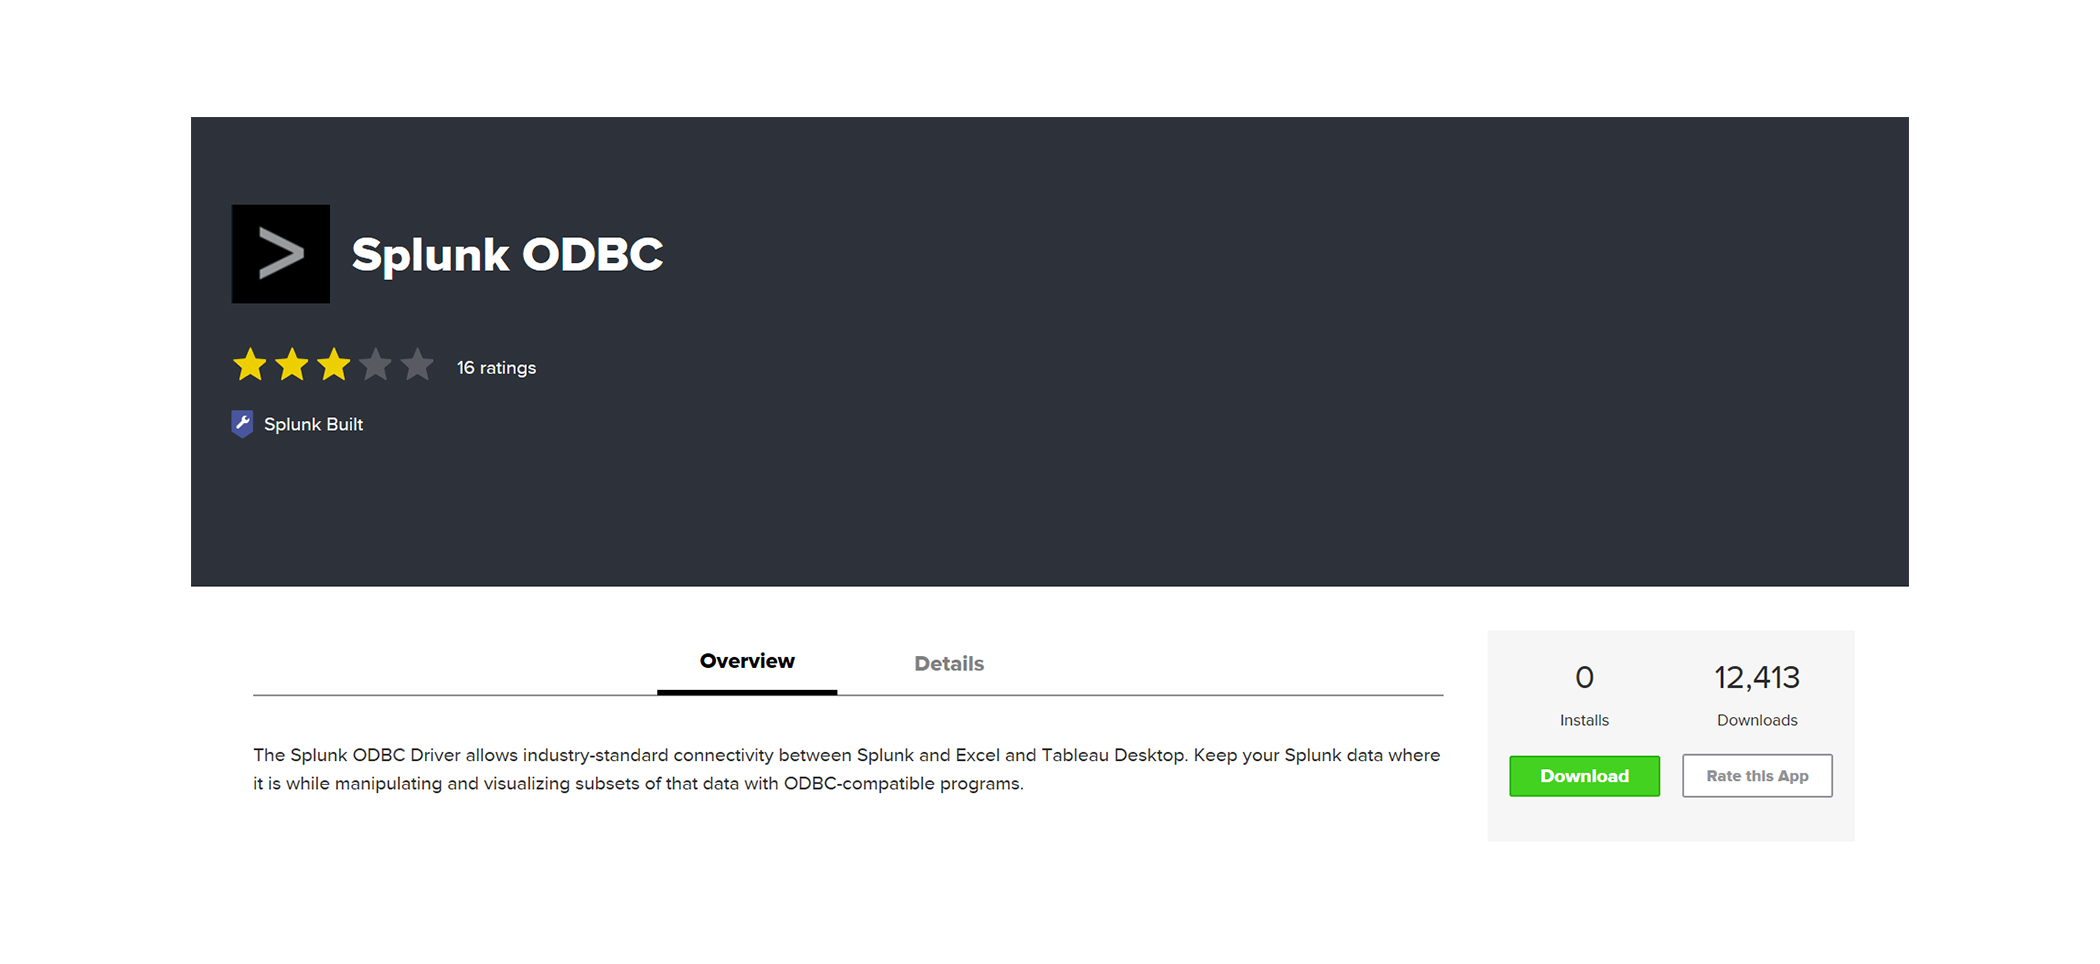
Installation
- The archive has two files: for MSExcel 32-bit, or 64-bit.
You can see the version of MSExcel on the tab “File” - “Account” - “About Excel” . We select the necessary version and run SplunkODBC64.msi or SplunkODBC32.msi. - We begin the installation and create a data source.
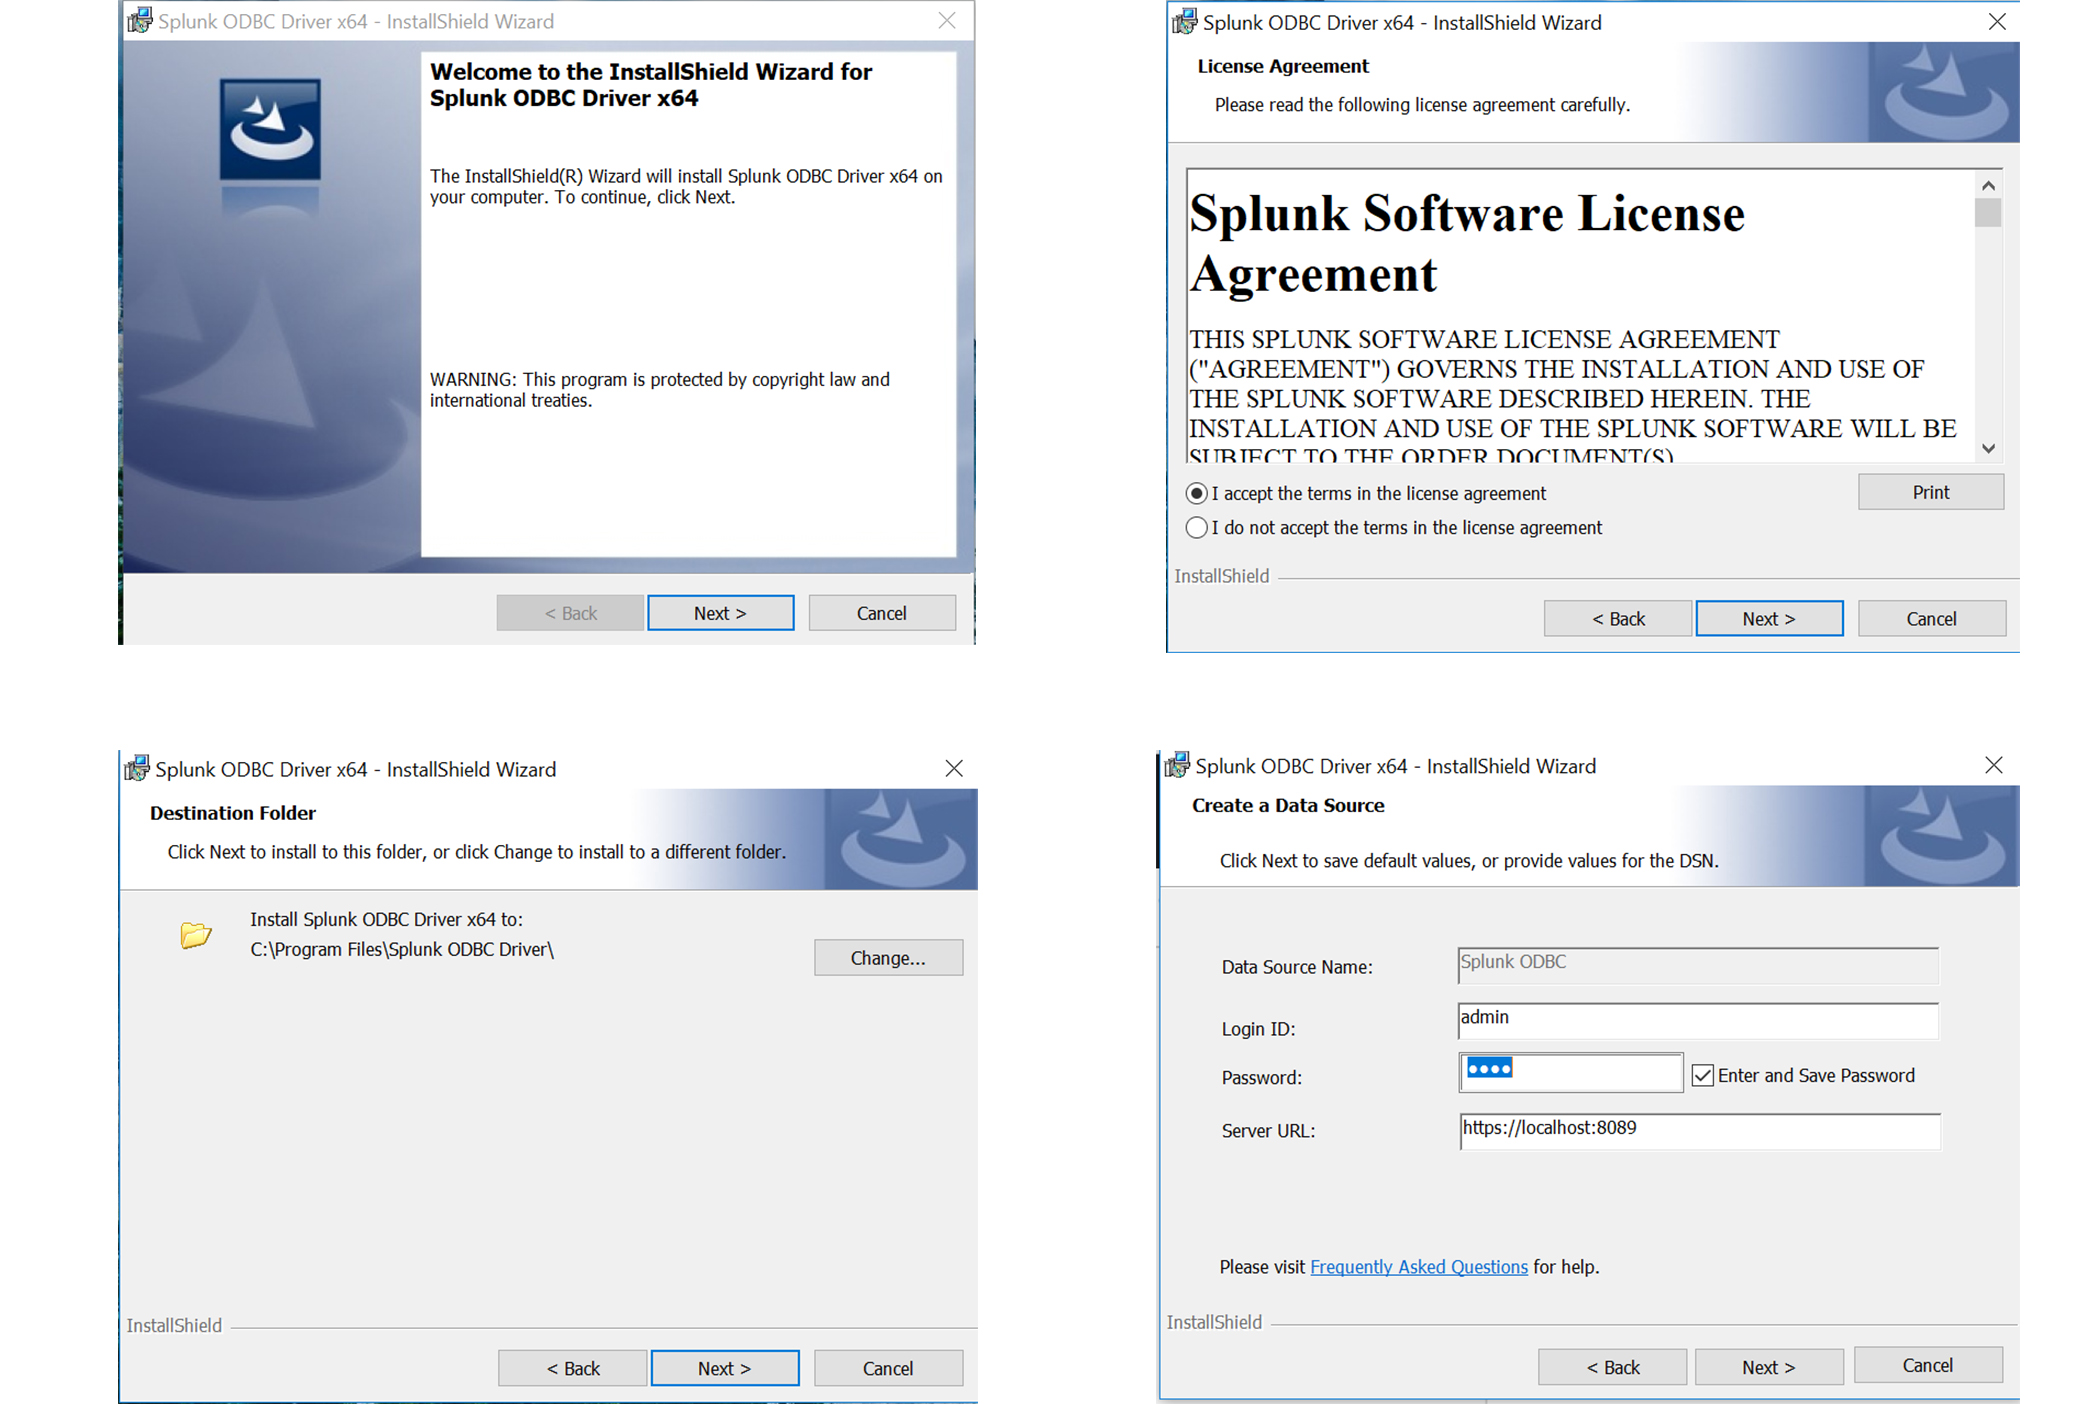
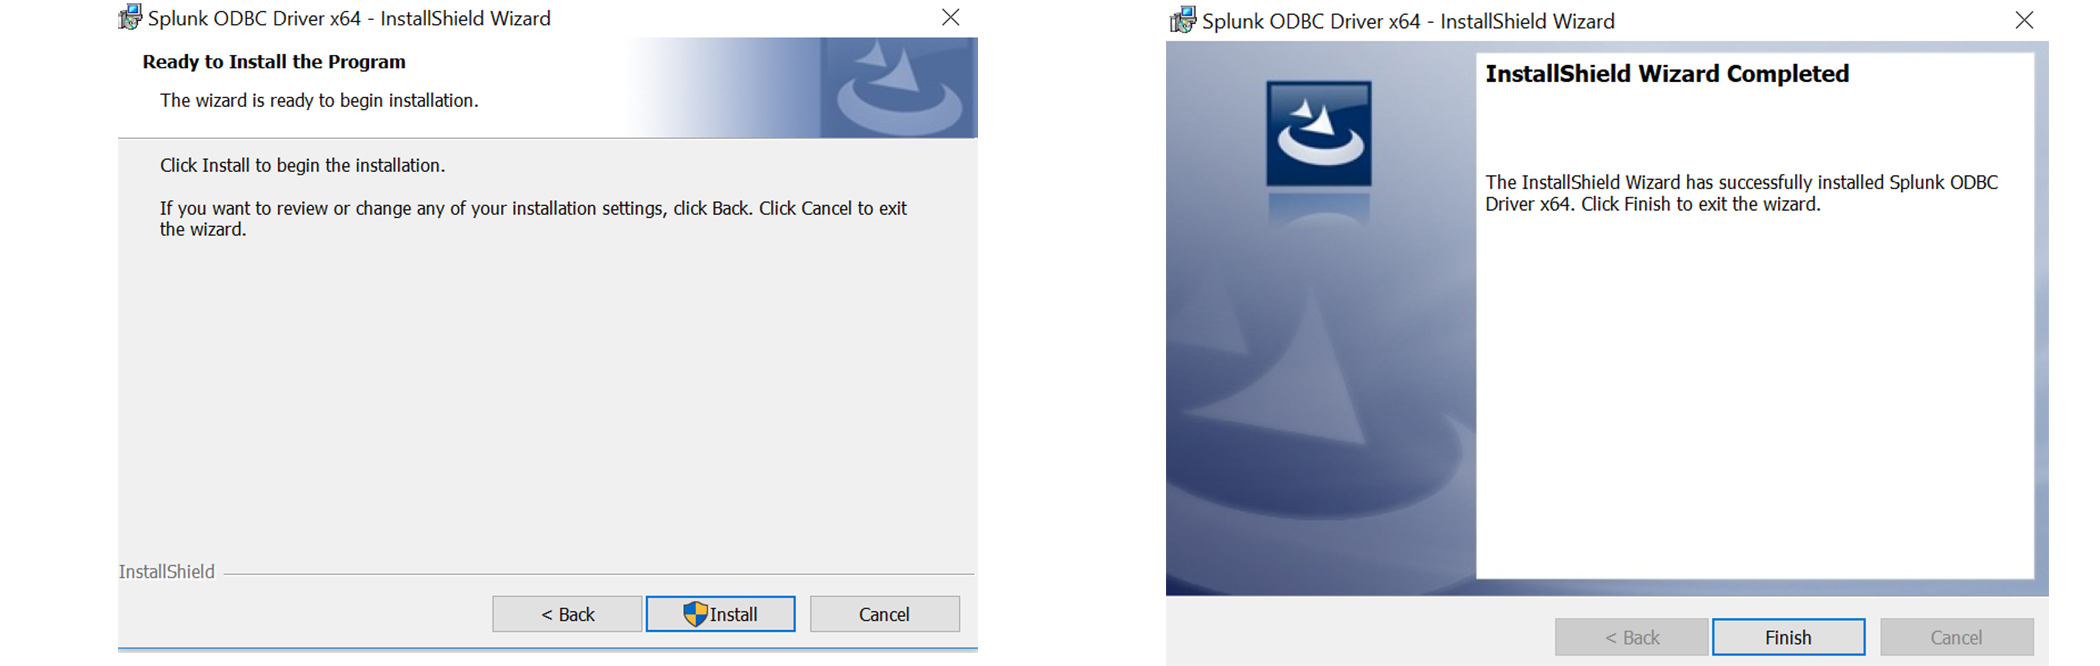
Enter the user login. You can leave the password blank and enter it each time, or check the box that we enter the password now and save it. Enter the URL of the Splunk Enterprise server, specify the port number 8089. - Finish the installation.
- The archive has two files: for MSExcel 32-bit, or 64-bit.
Check the installation.
Open the ODBC Data Sources program (Path: C: \ ProgramData \ Microsoft \ Windows \ Start Menu \ Programs \ Administrative Tools )
In the System DSN section, there should be a Splunk ODBC driver. By clicking on the name of the driver, you can change its parameters: login, password, source address.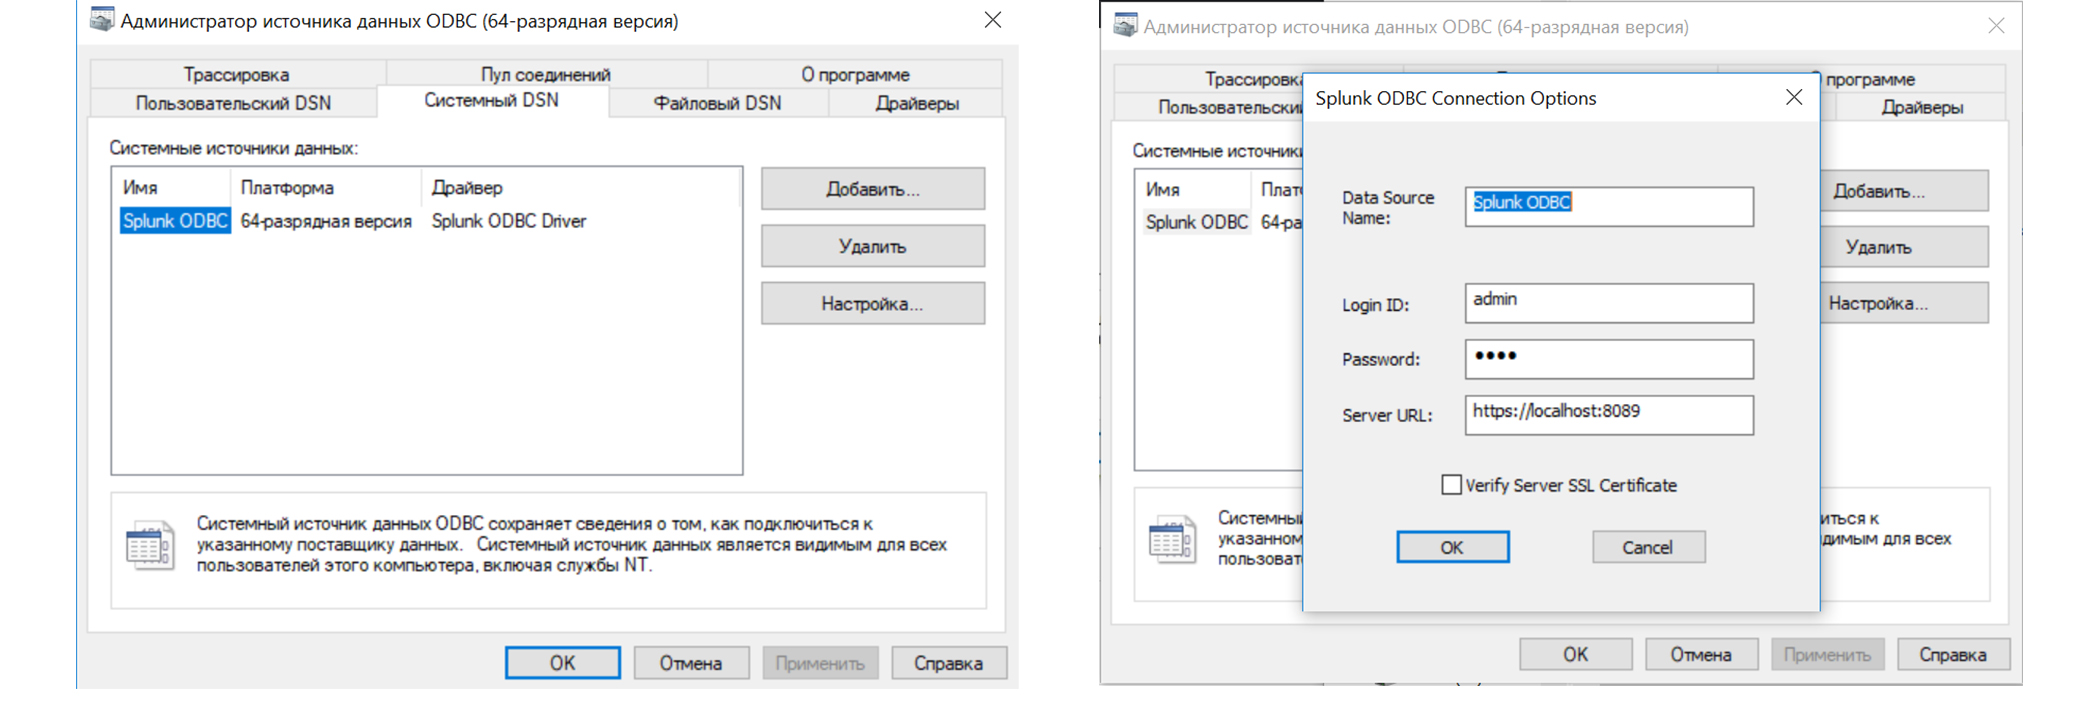
Using a driver in Excel
- Open the necessary .xls document. This may be a blank document or already have preliminary information. There is a table in our document that we will fill out using information from Splunk.

- In the "Data" - "Get Data" - "From Other Sources" - "From Microsoft Query" .

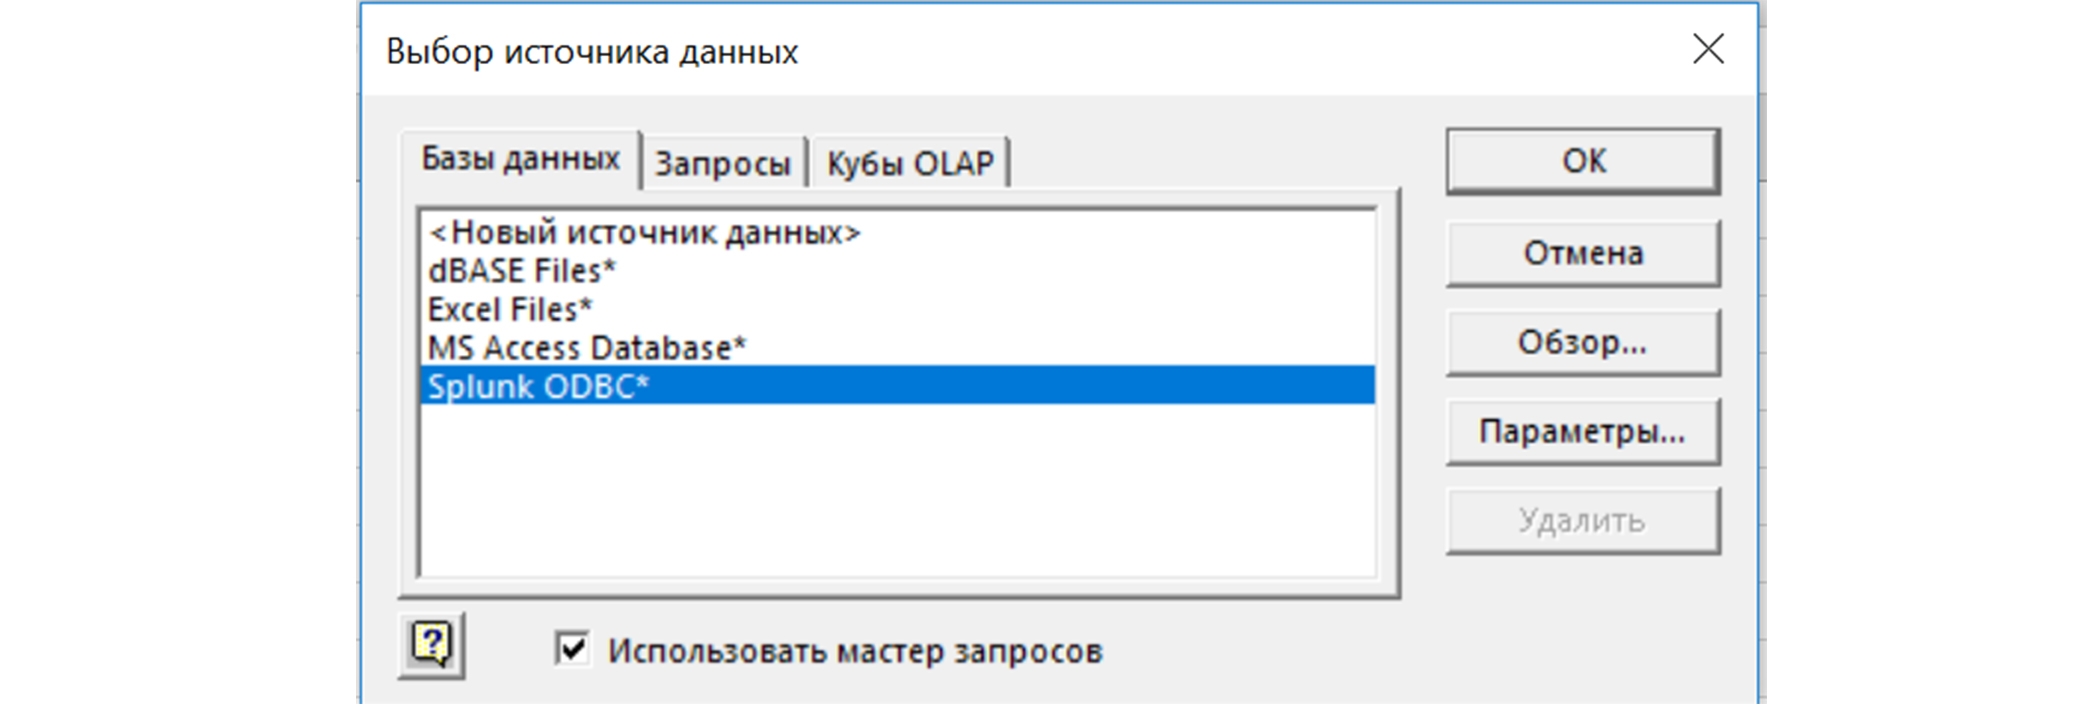
- Select the data source “Splunk ODBC *”, check the box “Use query wizard”.
- In the query creation window, we will be presented with a list of available tables from Splunk.
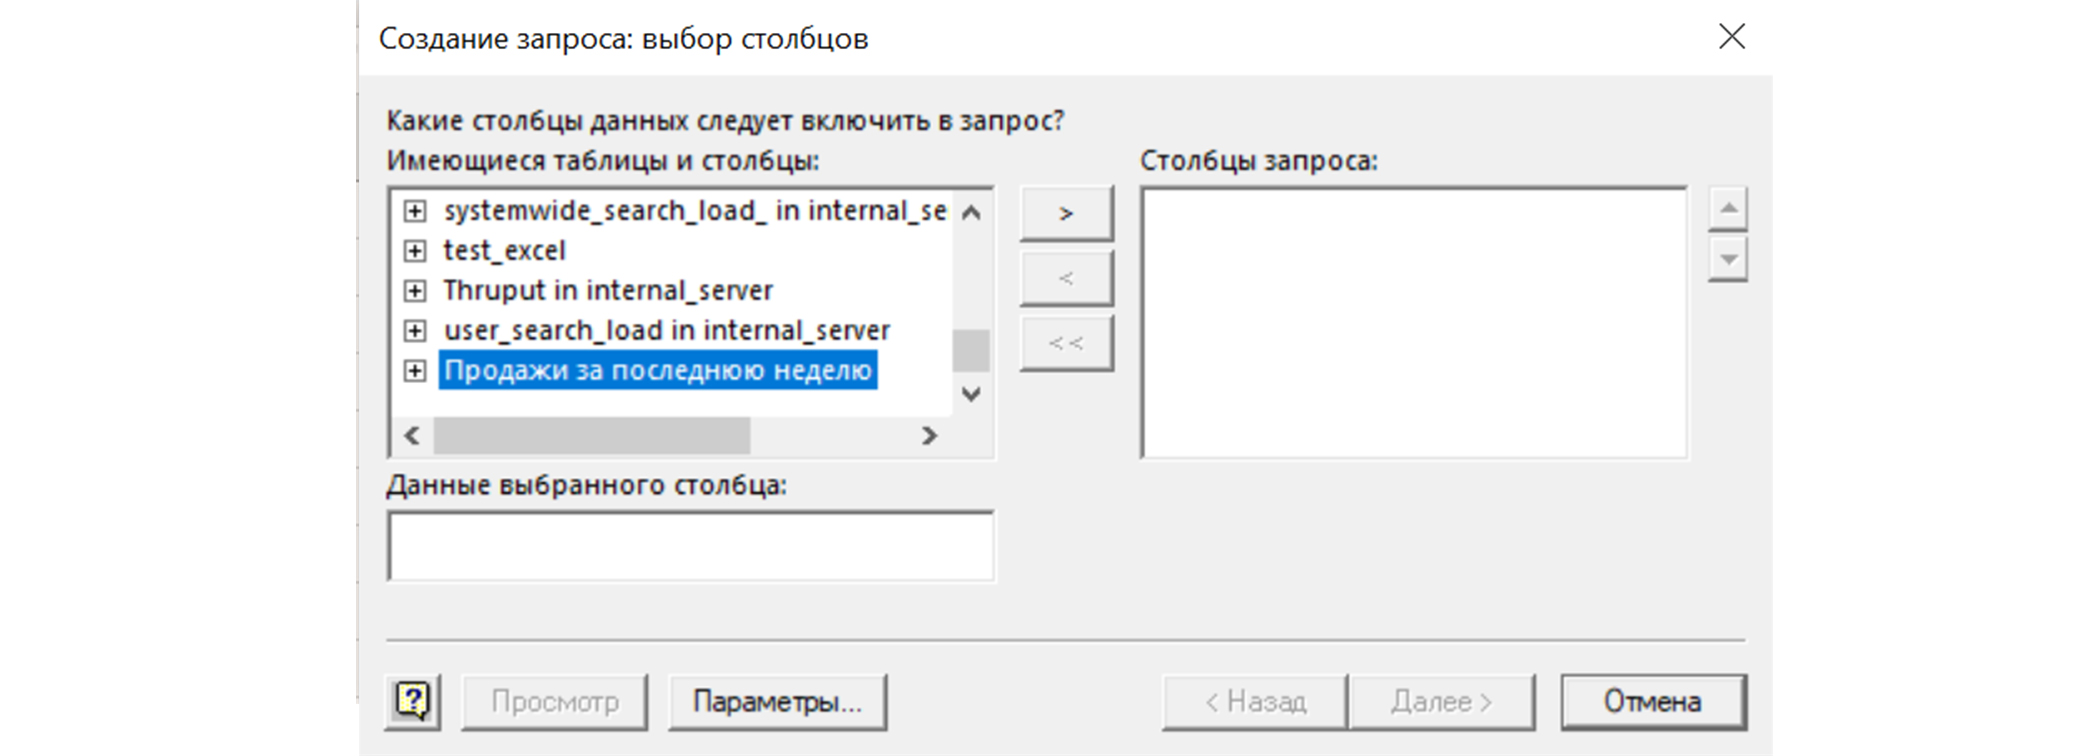
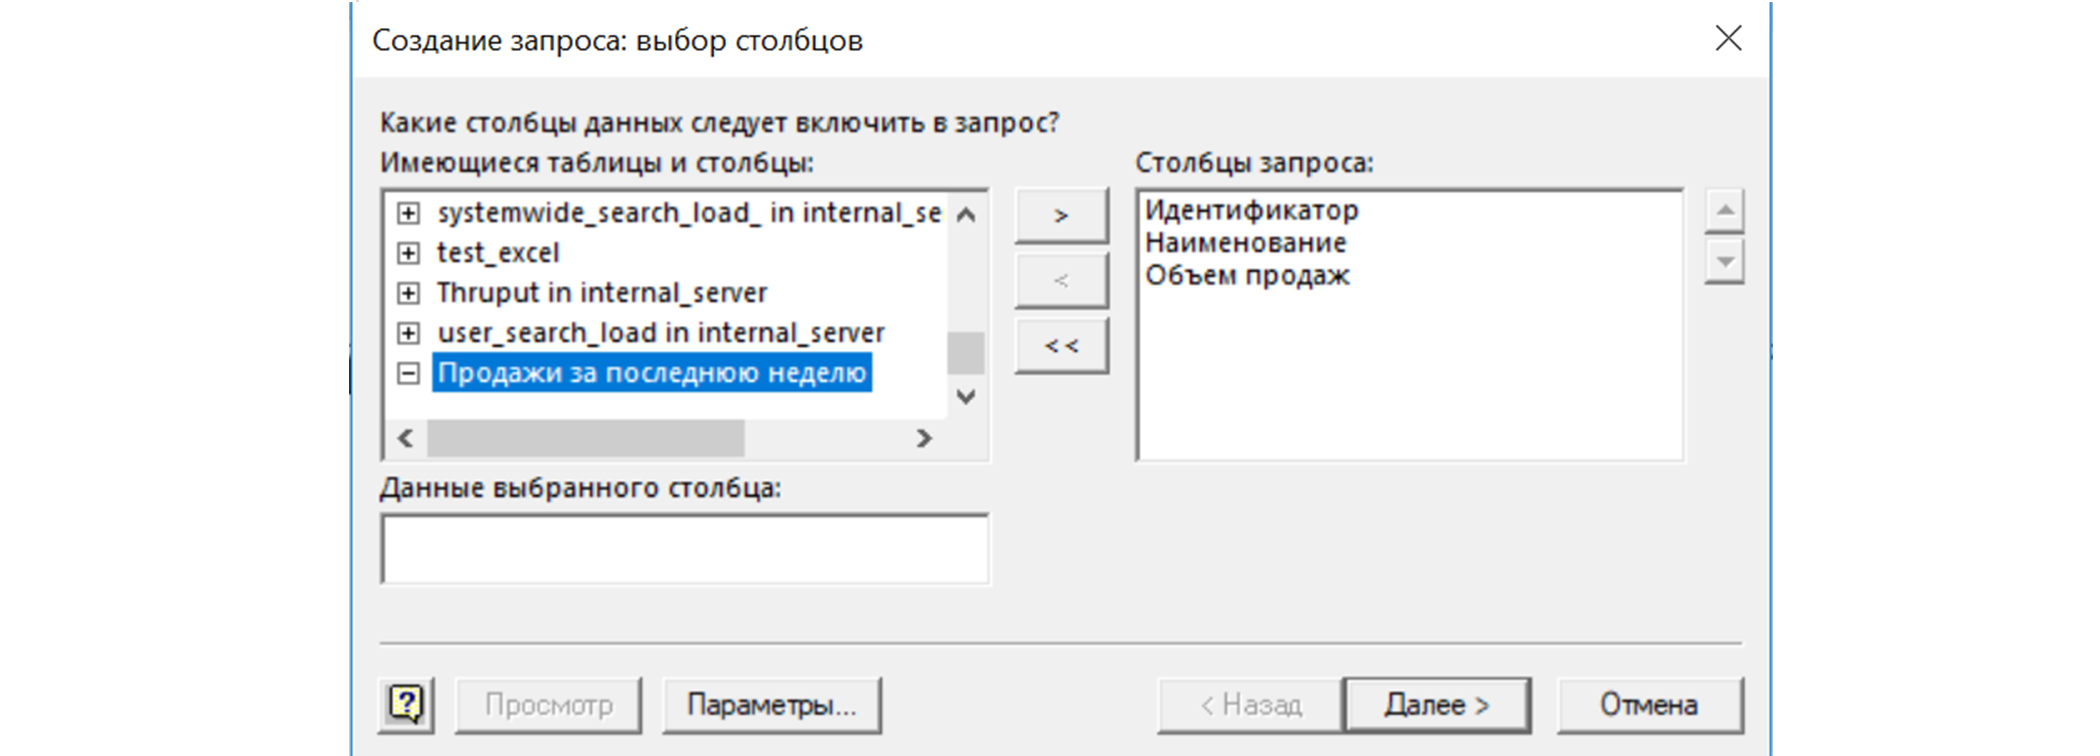
- Select the table saved in the first step and the columns from it.
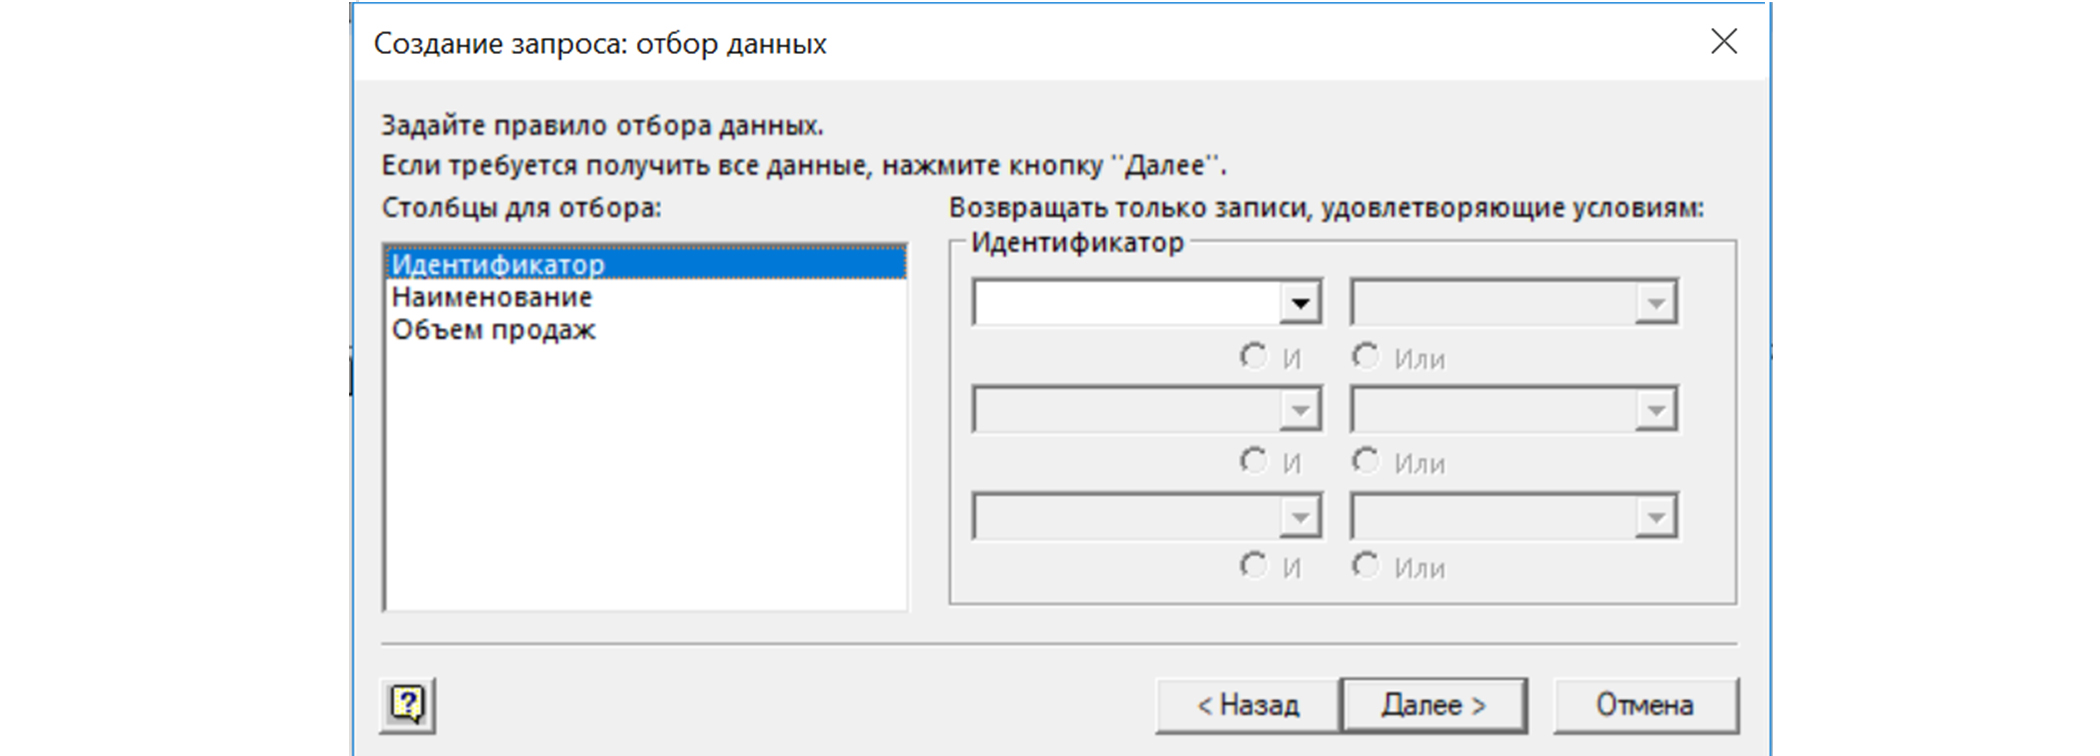
- Next, you can set a data selection rule, for example, count> 1000. But since we have a ready-made table, we leave the conditions empty and click Next.
- Specify the sorting conditions.

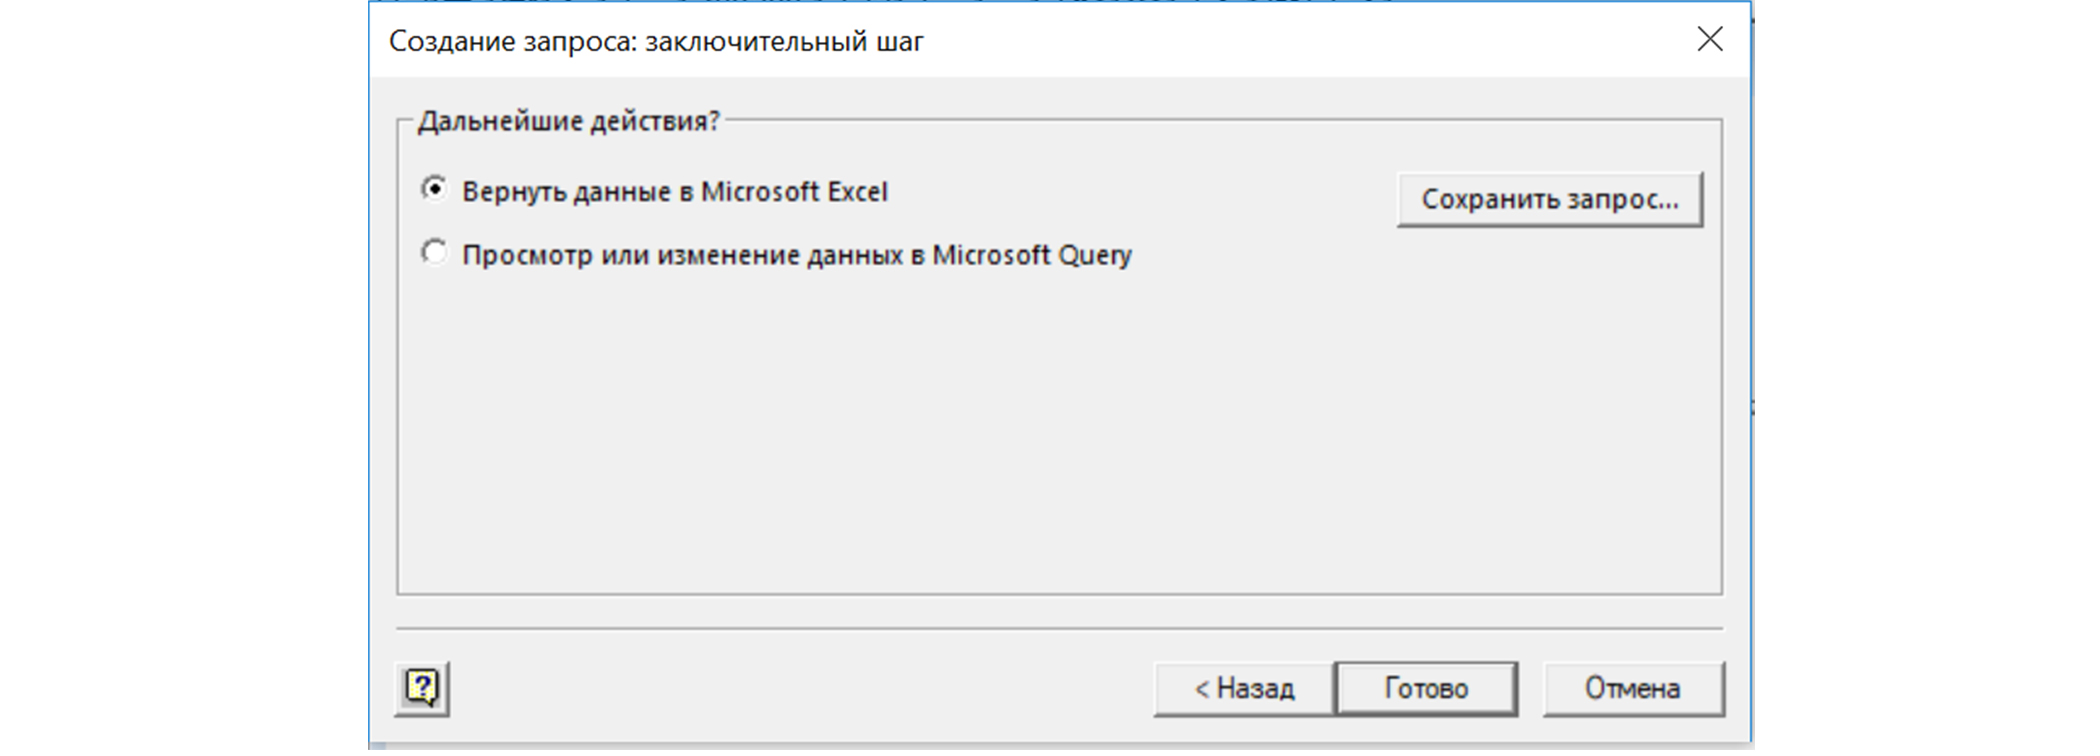
- We set the condition that you need to return data to Excel.
- Choose a way to present the data.

- The data is uploaded, and we can update it at any time by clicking the "Update All" button .

- Open the necessary .xls document. This may be a blank document or already have preliminary information. There is a table in our document that we will fill out using information from Splunk.
Add information to the table template
Using the formula: = ESND (VLOOKUP (A: A; Table_Request_of_Splunk_ODBC_1; 3; FALSE); 0)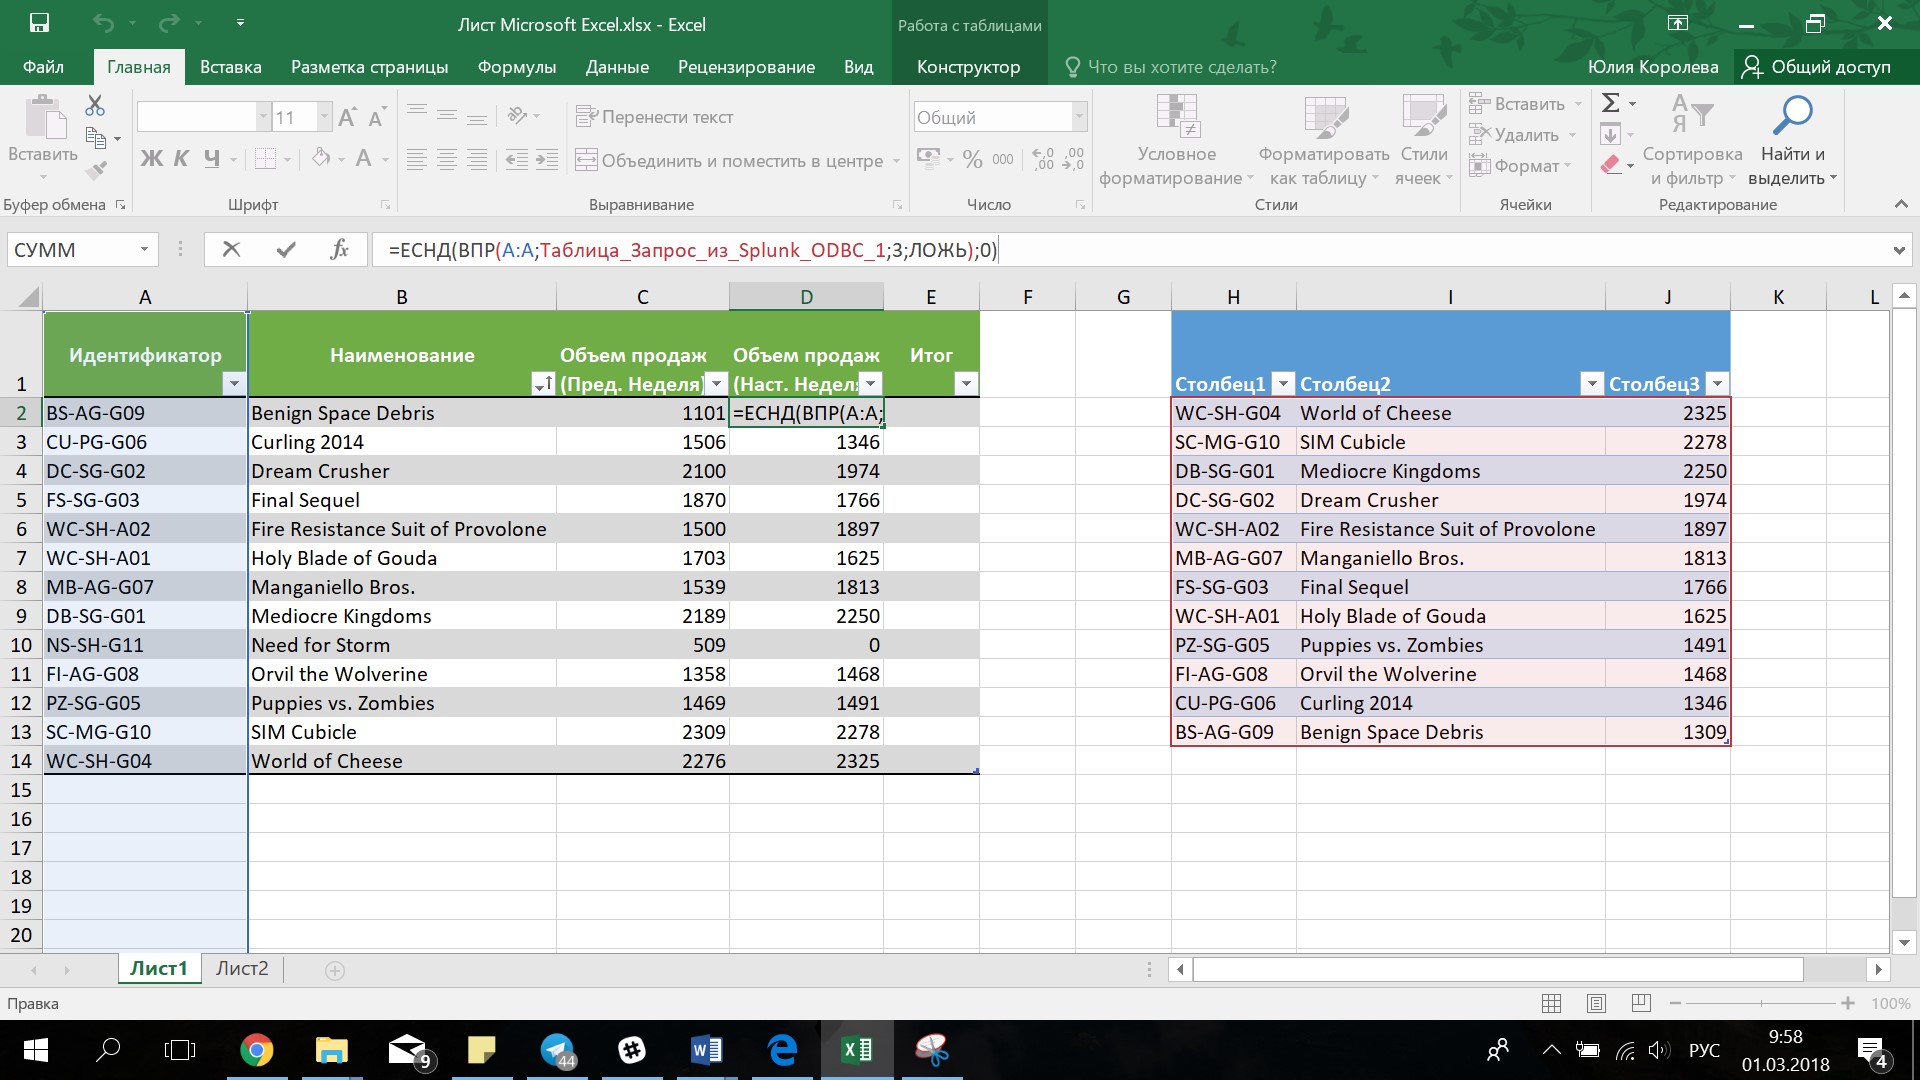
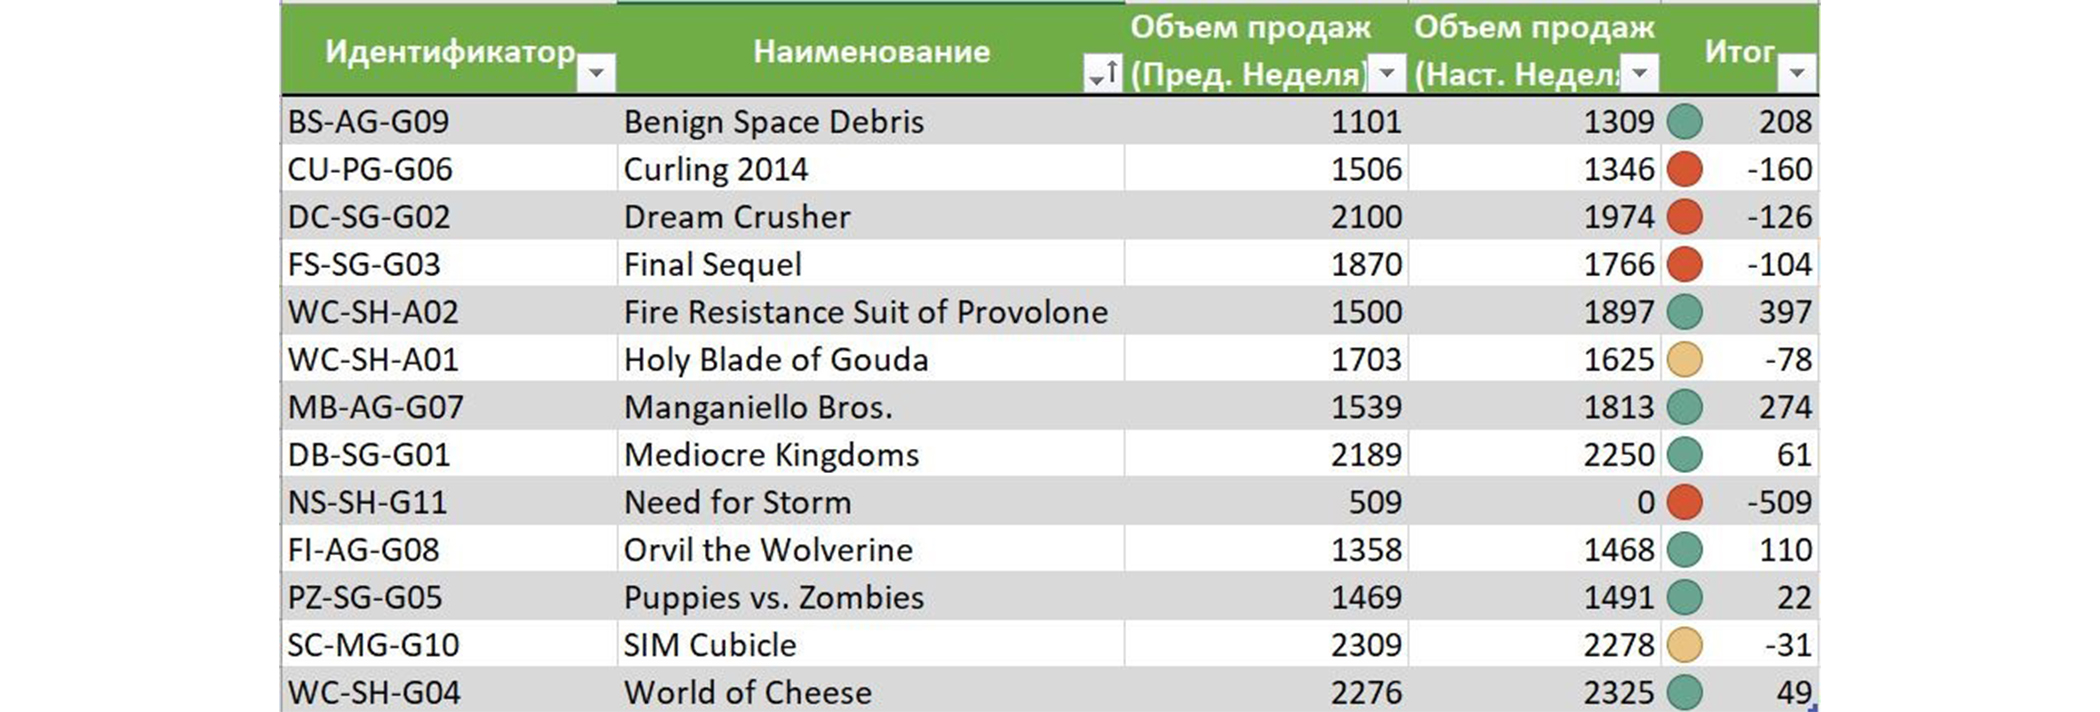
We get the final result.

Conclusion
Thus, by installing and configuring the ODBC driver, you can download the results of any queries stored in Splunk into Excel in a few clicks. If necessary, carry out their filtering and sorting and obtain useful data for further analytics in Excel.
We are happy to answer all your questions and comments on this topic. Also, if you are interested in something specifically in this area, or in the field of machine data analysis in general, we are ready to finalize the existing solutions for you, for your specific task. To do this, you can write about it in the comments or simply send us a request through the form on our website .