How we teach AI to help find employees
SuperJob lead developer Sergey Saygushkin talks about data preparation and training a resume scoring model, implementation in production, monitoring of quality metrics and AB testing of resume scoring functionality.
The article was prepared based on the materials of the report at RIT 2017 "Ranking of responses of applicants using machine learning."
There are two basic ways a recruiter works with SuperJob. Using the internal search of the service, you can look through the resume and invite suitable specialists for interviews. And you can post a vacancy and work with the feedback of specialists.
15% of vacancies on SuperJob receive more than 100 responses per day. Applicants do not always submit resumes corresponding to the position. Therefore, eychars have to spend extra time to select the right candidates.
For example, the vacancy “Leading PHP developer” will surely collect the feedback of the “1C” programmer, technical writer and even marketing director. This complicates and slows down the selection of even one position. And in the work of a recruiter at the same time there are several dozen vacancies.
We have developed a resume scoring algorithm that automatically selects resumes that are not at all suitable for a vacancy. Using it, we determine irrelevant responses and pessimize them in the list of responses in the personal account of the employer. We get the task of classifying into two classes:
+ suitable
- unsuitable response
And we give the recruiter the opportunity to filter the responses by this attribute in your personal account.
Preparing data for training is one of the most important steps. Your success depends on how carefully prepared this stage is. We study at events from the personal account of a recruiter. The sample includes approximately 10-12 million events over the past 3 months.
As class labels, we use resume rejection events and interview invitations. If a recruiter immediately rejects a resume without an invitation to an interview, then it is most likely irrelevant. Accordingly, if the recruiter invites for an interview (even if subsequently rejects), then the response is relevant to the vacancy.
For each vacancy, we check the distribution of interview invitations and rejections without consideration and, accordingly, do not train the model on vacancy events in which the number of rejections significantly exceeds the number of invitations. Or vice versa: where the recruiter invites everyone in a row (or rejects everyone in a row), we also consider such vacancies emissions.
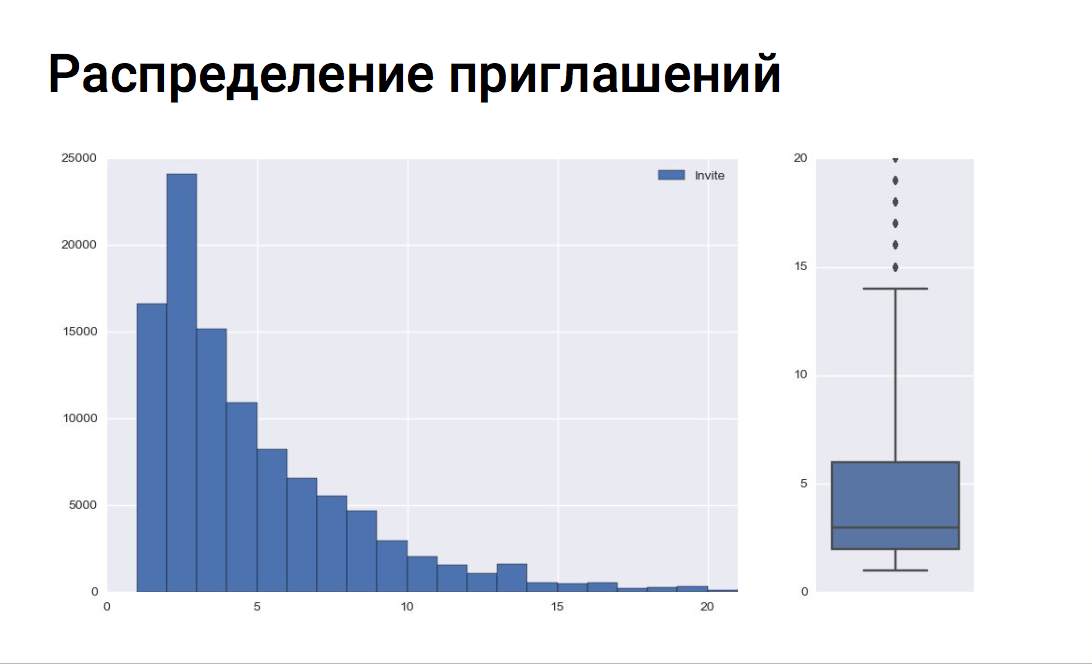
X axis - number of interview invitations
Y axis - number of vacancies
The graph shows that recruiters generally invite 5-6 job seekers for one vacancy. According to the box raft, you can evaluate the median of the invitations, the upper and lower quartiles and identify emissions. In our example, all vacancies with more than 14 job invitations are outliers.
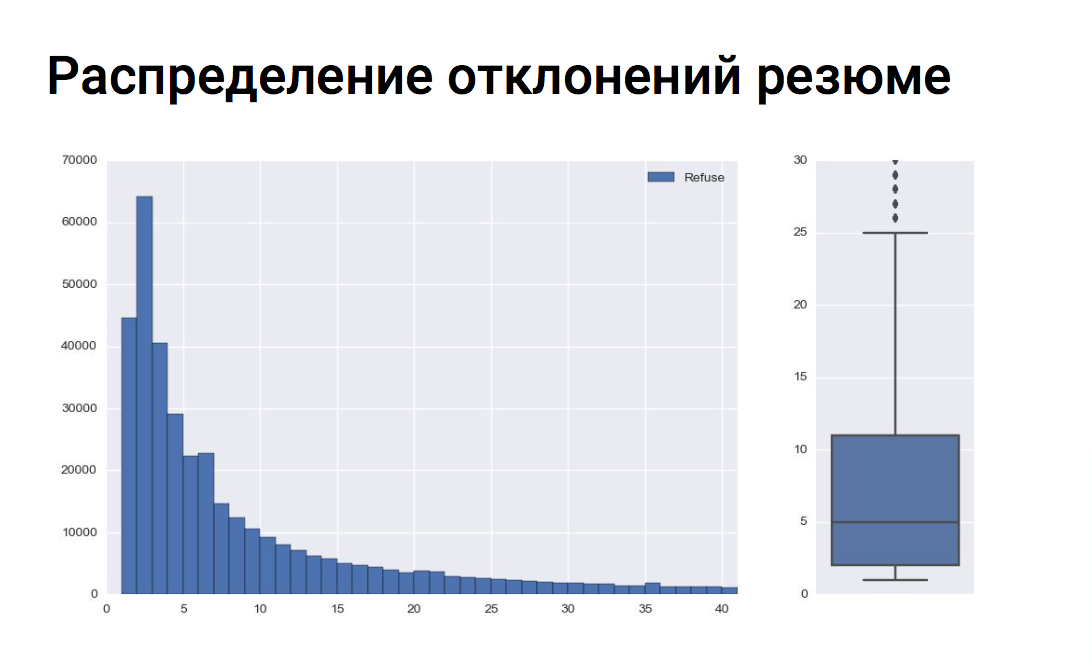
X axis - the number of deviations of the resume
Y axis - the number of vacancies
On average, for a single vacancy, a recruiter rejects 8-9 applicants. And all vacancies with the number of deviations of more than 25 are outliers, which can be seen on the boxplot.
After training the model for each recruiter, we built our own error matrix and found a cluster of employers that our model did not cope well with. After analyzing the log of actions of these recruiters, it became clear why the model pessimized the responses of the applicants, who were then invited for an interview. These recruiters massively invited for an interview applicants with resumes in general from another professional field that does not correspond to a vacancy, that is, they invited everyone in a row. That is, the vacancy diverged from the resume of the invited candidate almost completely. Oddly enough, these were mainly customers with an unlimited tariff. They get full access to the database and take in quantity, not quality. We included these recruiters in the black list and were not trained on their actions, as the behavior pattern diverged from the task.
The most memorable example was the vacancy of the Moscow Metro police. The recruiter invited anyone for an interview: sellers, sales representatives, actors - and rejected employees of the national guard and police. Perhaps he confused the buttons “reject” and “invite” in the interface of his personal account.

Characterization
Our model uses over 170 features. All attributes are based on job properties, resumes, and combinations thereof. Examples include the salary plug of a vacancy, the desired salary of a resume, and getting the salary of a resume into the salary plug of a vacancy as a combination of the characteristics of a resume and a vacancy.
We apply binary coding (One-Hot Encoding) to categorical attributes. The requirement of a vacancy regarding the presence of a certain type of education, category of driver’s license or knowledge of one of the foreign languages is revealed in several binary features for the model.
Work with text attributes:
We clear the text from stop words, punctuation, and lemmatize. From the test signs we form thematic groups:
For each group we train our TF-IDF Vectorizer. We get vectorizers trained on the entire list of professions, on all job requirements, together with resume skills, etc. For example, we have such a feature as the similarity of a profession from a vacancy to professions from the experience of the applicant. For each phrase, we get a tf-idf vector and calculate cosine similarity (cosine of the angle between the vectors) with the vector of another phrase by scalar multiplication of vectors. Thus, we obtain a measure of the similarity of the two phrases.
In the process of generating features, we consulted with the SuperJob Research Center. A survey was launched for recruiters to identify the most significant signs by which they decide whether to invite a candidate or reject.
The results are expected: recruiters look at work experience, duration of work in last place, and average duration of work in all companies. Whether the desired position from the resume is new to the candidate, i.e. whether he worked in this profession before or not. We took into account the survey data when compiling the characteristics for the model.
Examples of signs:
To solve the classification problem, we use the xgboost gradient boost implementation.
After training the model, we were able to collect statistics on significant grounds. Among the significant signs expected were work experience, salary features, getting the desired salary from the resume into the salary plug of the vacancy, a measure of the similarity of the job profession and the job experience of the job seeker, the similarity of job requirements and key resume skills.
Also in the top of the signs was the age of the applicant. We decided to conduct an experiment and removed this feature, because we did not want to discriminate against our applicants. As a result, the feature “the number of years since graduation”, which obviously correlates with age, got to the top. We removed this symptom and re-trained the model. After all the manipulations with age, we saw that the model’s quality metrics sank a bit. As a result, we decided to return age, because in mass selection, he is really important to the recruiter, they pay attention to him. But we compensate scoring points for applicants aged if their response does not reach the relevant one a bit, because We believe that it was the age of the applicant that pessimized his resume.
After several iterations on training the model, preparing features, we got a model with good quality metrics.
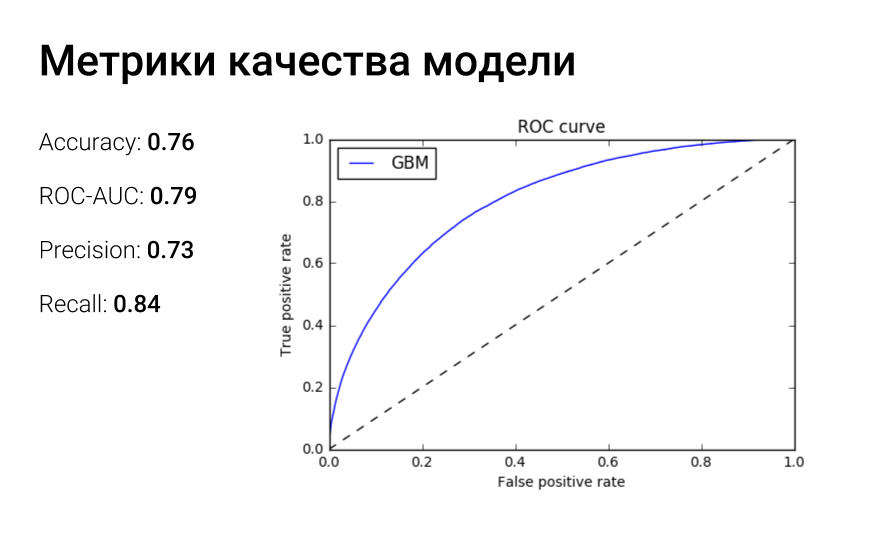
The ROC curve shows the dependence of the share of true positive classifications on the share of false positive classifications. And the area under the roc-curve can be interpreted as follows: auc-roc is equal to the probability that a randomly taken class 1 object will get a higher rating than a randomly taken class 0 object.
We do not stop at this model and conduct new experiments. We are currently working on filling out a list of synonyms for professions, using doc2vec to more accurately determine the fact that the profession from the resume corresponds to the profession of the vacancy, and so that the lead php developer and senior php developer are not different professions for the model. Work is also underway on thematic modeling using the BigARTM library to obtain key job topics and resumes.
We also needed that as few suitable resumes as possible appeared in irrelevant, i.e. we must minimize the number of errors of the second kind or false negative responses. To do this, we slightly reduced the threshold probability of belonging to the relevant class. Thus, the number of FN errors was reduced. But this had the opposite effect: the number of FP errors increased.

On the Flask framework, they implemented a small microservice with a REST scoring API, packed it into a docker container and deployed to a server dedicated to this task. A uWSGI web server was launched in the container with a master process and 24 worker processes, one per core.
After the user responds to the vacancy on the site, a message about this fact falls into the rabbitmq queue. The queue handler receives a message, prepares data, a job object, a resume object, and calls the scoring endpoint api. Further, the scoring value is stored in the database for subsequent filtering of responses by the recruiter in your personal account.
At first, we wanted to implement online scoring directly when contacting your personal account, but, having estimated the number of responses to some vacancies and the total time the model worked on one pair of resume-vacancy, we implemented scoring in asynchronous mode.
The scoring process itself takes about 0.04-0.05 seconds. Thus, to recalculate the scoring value for all active responses on the current hardware, it will take about 18-20 hours. On the one hand, this is a big figure, on the other hand, we recount scoring quite rarely, only when a new model is introduced into production. And with this problem at the moment you can somehow live.
The biggest burden on the scoring service is generated not by applicants responding to vacancies, but by our “subscription to resume” mailing service. This service is activated once a day and recommends job seekers for recruiter vacancies. Naturally, we should also speed up the result of the service, in order to advise the recruiter only relevant responses.
As a result, at the peak of work, we process 1000–1200 requests per second. If the number of responses that need to be scored increases, then we will put another server nearby and scale the scoring service horizontally.
In order to continuously evaluate the quality metrics of the model on the actual data of your personal account, we set up the monitoring task in jenkins. The script collects data from vertica several times a day according to invitations and rejections, watches how the model worked on these events, calculates metrics and sends it to the monitoring system.
We can also compare metrics of different scoring models on the same data from your personal account. We do not immediately introduce new models, first we will speed up all the responses with the experimental model, save the scoring values to the database, and then on the charts we will see if the experimental models work better or worse.
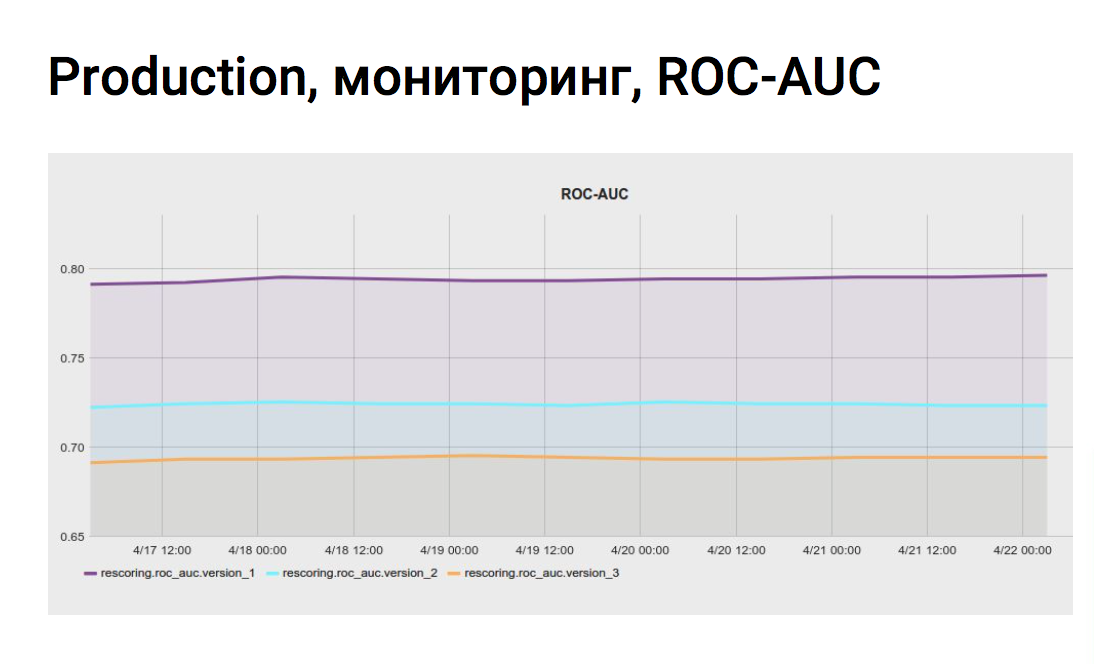
Graphs make our life calmer, we are sure that the quality of scoring has not changed and all the stages work as usual.
Two tabs appeared in the list of responses to a certain vacancy, suitable and unsuitable responses. As an example, the same vacancy is the leading php programmer in SuperJob. The resume of the php programmer, even if it’s not a leading or senior one, and the resume of a fullstack developer with knowledge of php got the right response, and the resume of the .net programmer and the head of the it department were expected to be inappropriate.


After implementing scoring functionality, we conducted an ab-test on recruiters.
For the test, we selected the following metrics:
We performed this test with a significance level of 5%, which means that there is a 5% chance of a first-type error or false positive.
After ab-testing, we collected feedback from recruiters who fell into the option with scoring functionality. Feedback was also positive. They use the functionality, spend less time on mass selection.
The most important thing is the training sample.
We monitor the quality metrics of the model.
We fix random_state.
The article was prepared based on the materials of the report at RIT 2017 "Ranking of responses of applicants using machine learning."
Why are recruiters lacking AI?
There are two basic ways a recruiter works with SuperJob. Using the internal search of the service, you can look through the resume and invite suitable specialists for interviews. And you can post a vacancy and work with the feedback of specialists.
15% of vacancies on SuperJob receive more than 100 responses per day. Applicants do not always submit resumes corresponding to the position. Therefore, eychars have to spend extra time to select the right candidates.
For example, the vacancy “Leading PHP developer” will surely collect the feedback of the “1C” programmer, technical writer and even marketing director. This complicates and slows down the selection of even one position. And in the work of a recruiter at the same time there are several dozen vacancies.
We have developed a resume scoring algorithm that automatically selects resumes that are not at all suitable for a vacancy. Using it, we determine irrelevant responses and pessimize them in the list of responses in the personal account of the employer. We get the task of classifying into two classes:
+ suitable
- unsuitable response
And we give the recruiter the opportunity to filter the responses by this attribute in your personal account.
Prepare data in summer, winter, autumn and spring. And more - in the summer
Preparing data for training is one of the most important steps. Your success depends on how carefully prepared this stage is. We study at events from the personal account of a recruiter. The sample includes approximately 10-12 million events over the past 3 months.
As class labels, we use resume rejection events and interview invitations. If a recruiter immediately rejects a resume without an invitation to an interview, then it is most likely irrelevant. Accordingly, if the recruiter invites for an interview (even if subsequently rejects), then the response is relevant to the vacancy.
For each vacancy, we check the distribution of interview invitations and rejections without consideration and, accordingly, do not train the model on vacancy events in which the number of rejections significantly exceeds the number of invitations. Or vice versa: where the recruiter invites everyone in a row (or rejects everyone in a row), we also consider such vacancies emissions.

X axis - number of interview invitations
Y axis - number of vacancies
The graph shows that recruiters generally invite 5-6 job seekers for one vacancy. According to the box raft, you can evaluate the median of the invitations, the upper and lower quartiles and identify emissions. In our example, all vacancies with more than 14 job invitations are outliers.

X axis - the number of deviations of the resume
Y axis - the number of vacancies
On average, for a single vacancy, a recruiter rejects 8-9 applicants. And all vacancies with the number of deviations of more than 25 are outliers, which can be seen on the boxplot.
Who does not want to work with his head - works with his hands
After training the model for each recruiter, we built our own error matrix and found a cluster of employers that our model did not cope well with. After analyzing the log of actions of these recruiters, it became clear why the model pessimized the responses of the applicants, who were then invited for an interview. These recruiters massively invited for an interview applicants with resumes in general from another professional field that does not correspond to a vacancy, that is, they invited everyone in a row. That is, the vacancy diverged from the resume of the invited candidate almost completely. Oddly enough, these were mainly customers with an unlimited tariff. They get full access to the database and take in quantity, not quality. We included these recruiters in the black list and were not trained on their actions, as the behavior pattern diverged from the task.
The most memorable example was the vacancy of the Moscow Metro police. The recruiter invited anyone for an interview: sellers, sales representatives, actors - and rejected employees of the national guard and police. Perhaps he confused the buttons “reject” and “invite” in the interface of his personal account.

Characterization
Our model uses over 170 features. All attributes are based on job properties, resumes, and combinations thereof. Examples include the salary plug of a vacancy, the desired salary of a resume, and getting the salary of a resume into the salary plug of a vacancy as a combination of the characteristics of a resume and a vacancy.
We apply binary coding (One-Hot Encoding) to categorical attributes. The requirement of a vacancy regarding the presence of a certain type of education, category of driver’s license or knowledge of one of the foreign languages is revealed in several binary features for the model.
Work with text attributes:
We clear the text from stop words, punctuation, and lemmatize. From the test signs we form thematic groups:
- profession vacancies and professions from resumes;
- job requirements and key resume skills;
- duties of the vacancy and duties from the previous places of work of the applicant.
For each group we train our TF-IDF Vectorizer. We get vectorizers trained on the entire list of professions, on all job requirements, together with resume skills, etc. For example, we have such a feature as the similarity of a profession from a vacancy to professions from the experience of the applicant. For each phrase, we get a tf-idf vector and calculate cosine similarity (cosine of the angle between the vectors) with the vector of another phrase by scalar multiplication of vectors. Thus, we obtain a measure of the similarity of the two phrases.
In the process of generating features, we consulted with the SuperJob Research Center. A survey was launched for recruiters to identify the most significant signs by which they decide whether to invite a candidate or reject.
The results are expected: recruiters look at work experience, duration of work in last place, and average duration of work in all companies. Whether the desired position from the resume is new to the candidate, i.e. whether he worked in this profession before or not. We took into account the survey data when compiling the characteristics for the model.
Examples of signs:
- average duration of work in one place, in months;
- number of months of work in last place;
- the difference between the required vacancy experience and the experience from the resume;
- getting the desired resume salary into the salary plug of the vacancy;
- a measure of the similarity between the desired position and the previous place of work;
- a measure of similarity between the specialty of education and the requirements of the vacancy;
- rating (completeness) of the resume.
When it doubt, use xgboost
To solve the classification problem, we use the xgboost gradient boost implementation.
After training the model, we were able to collect statistics on significant grounds. Among the significant signs expected were work experience, salary features, getting the desired salary from the resume into the salary plug of the vacancy, a measure of the similarity of the job profession and the job experience of the job seeker, the similarity of job requirements and key resume skills.
Also in the top of the signs was the age of the applicant. We decided to conduct an experiment and removed this feature, because we did not want to discriminate against our applicants. As a result, the feature “the number of years since graduation”, which obviously correlates with age, got to the top. We removed this symptom and re-trained the model. After all the manipulations with age, we saw that the model’s quality metrics sank a bit. As a result, we decided to return age, because in mass selection, he is really important to the recruiter, they pay attention to him. But we compensate scoring points for applicants aged if their response does not reach the relevant one a bit, because We believe that it was the age of the applicant that pessimized his resume.
After several iterations on training the model, preparing features, we got a model with good quality metrics.

The ROC curve shows the dependence of the share of true positive classifications on the share of false positive classifications. And the area under the roc-curve can be interpreted as follows: auc-roc is equal to the probability that a randomly taken class 1 object will get a higher rating than a randomly taken class 0 object.
We do not stop at this model and conduct new experiments. We are currently working on filling out a list of synonyms for professions, using doc2vec to more accurately determine the fact that the profession from the resume corresponds to the profession of the vacancy, and so that the lead php developer and senior php developer are not different professions for the model. Work is also underway on thematic modeling using the BigARTM library to obtain key job topics and resumes.
We also needed that as few suitable resumes as possible appeared in irrelevant, i.e. we must minimize the number of errors of the second kind or false negative responses. To do this, we slightly reduced the threshold probability of belonging to the relevant class. Thus, the number of FN errors was reduced. But this had the opposite effect: the number of FP errors increased.

On the Flask framework, they implemented a small microservice with a REST scoring API, packed it into a docker container and deployed to a server dedicated to this task. A uWSGI web server was launched in the container with a master process and 24 worker processes, one per core.
After the user responds to the vacancy on the site, a message about this fact falls into the rabbitmq queue. The queue handler receives a message, prepares data, a job object, a resume object, and calls the scoring endpoint api. Further, the scoring value is stored in the database for subsequent filtering of responses by the recruiter in your personal account.
At first, we wanted to implement online scoring directly when contacting your personal account, but, having estimated the number of responses to some vacancies and the total time the model worked on one pair of resume-vacancy, we implemented scoring in asynchronous mode.
The scoring process itself takes about 0.04-0.05 seconds. Thus, to recalculate the scoring value for all active responses on the current hardware, it will take about 18-20 hours. On the one hand, this is a big figure, on the other hand, we recount scoring quite rarely, only when a new model is introduced into production. And with this problem at the moment you can somehow live.
The biggest burden on the scoring service is generated not by applicants responding to vacancies, but by our “subscription to resume” mailing service. This service is activated once a day and recommends job seekers for recruiter vacancies. Naturally, we should also speed up the result of the service, in order to advise the recruiter only relevant responses.
As a result, at the peak of work, we process 1000–1200 requests per second. If the number of responses that need to be scored increases, then we will put another server nearby and scale the scoring service horizontally.
Monitoring
In order to continuously evaluate the quality metrics of the model on the actual data of your personal account, we set up the monitoring task in jenkins. The script collects data from vertica several times a day according to invitations and rejections, watches how the model worked on these events, calculates metrics and sends it to the monitoring system.
We can also compare metrics of different scoring models on the same data from your personal account. We do not immediately introduce new models, first we will speed up all the responses with the experimental model, save the scoring values to the database, and then on the charts we will see if the experimental models work better or worse.

Graphs make our life calmer, we are sure that the quality of scoring has not changed and all the stages work as usual.
Implementation in your account
Two tabs appeared in the list of responses to a certain vacancy, suitable and unsuitable responses. As an example, the same vacancy is the leading php programmer in SuperJob. The resume of the php programmer, even if it’s not a leading or senior one, and the resume of a fullstack developer with knowledge of php got the right response, and the resume of the .net programmer and the head of the it department were expected to be inappropriate.


AB testing
After implementing scoring functionality, we conducted an ab-test on recruiters.
For the test, we selected the following metrics:
- Conversion of submitted CVs to invited - impact 8.3%
- The number of invited resumes - impact 6.7%
- Conversion of open vacancies to closed - impact 6.0%
- Number of job openings - impact 5.4%
- The number of days before the closing of vacancies - impact 7.7%
We performed this test with a significance level of 5%, which means that there is a 5% chance of a first-type error or false positive.
After ab-testing, we collected feedback from recruiters who fell into the option with scoring functionality. Feedback was also positive. They use the functionality, spend less time on mass selection.
findings
The most important thing is the training sample.
We monitor the quality metrics of the model.
We fix random_state.
