Twitter Infrastructure: Scale
- Transfer
Twitter Park Overview
Twitter came from an era when it was customary to install equipment from specialized manufacturers in data centers. Since then, we have continuously developed and updated the server fleet, striving to benefit from the latest open technology standards, as well as increase the efficiency of equipment to provide the best experience for users.
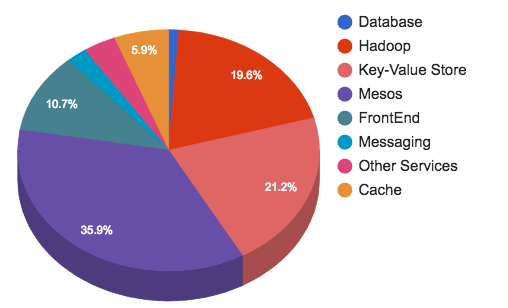
Our current equipment distribution is shown below:
Network traffic
We started leaving third-party hosting in early 2010. This means that we had to learn how to build and maintain our own infrastructure. Having vague ideas about the needs of basic infrastructure, we began to try different options for network architecture, equipment and manufacturers.
By the end of 2010, we had completed the first network architecture project. It was supposed to solve the scaling and maintenance problems that we experienced with the hoster. We had ToR switches with deep buffers for processing bursts of service traffic, as well as kernel and carrier-class switches without oversubscribing at this level. They supported an early version of Twitter that set some notable engineering achievements, such as TPS records (tweets per second) after the release of the Japanese film Castle in the Sky and during the 2014 FIFA World Cup.
If you quickly go back a couple of years, then we already had a network with points of presence on five continents and data centers with hundreds of thousands of servers. At the beginning of 2015, we began to experience some growth problems due to changes in the service architecture and increased power requirements, and ultimately reached the physical limitations of scalability in the data center, when the mesh topology could not withstand the addition of additional equipment in new racks. In addition, IGP in the existing data center began to behave unpredictably due to the increased routing scale and complexity of the topology.
To cope with this, we started converting existing data centers to the Clos + BGP topology - conversion, which had to be done on a live network. Despite the complexity, it was completed with minimal impact on services in a relatively short time. Now the network looks like this:
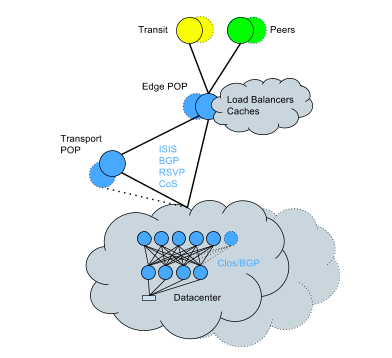
Key points of the new approach:
- Smaller impact radius from a single device failure.
- Horizontal bandwidth scaling capabilities.
- Smaller overhead of the routing engine on the CPU; much more efficient handling of routing changes.
- Higher routing capacity due to reduced CPU overhead.
- More detailed control of routing rules for each device and each connection.
- There is no longer any chance of encountering the root causes of the most serious incidents that have occurred in the past: increased protocol convergence time, problems with down routes, and unexpected problems due to the inherent complexity of OSPF.
- The ability to move racks without consequences.
Let's take a closer look at our network infrastructure.
Data Center Traffic
Tasks
Our first data center was built on the model of the capacity and traffic profiles of a well-known system installed at our hosting provider. Only a few years passed, and our data centers were 400% larger than in the original design. And now that our application stack has evolved and Twitter has become more distributed, traffic profiles have also changed. The initial assumptions on which the network design was developed at the beginning are no longer relevant.
Traffic is growing faster than we have time to redo the whole data center, so it is important to create a highly scalable architecture that will allow you to consistently add capacity instead of sudden migrations.
An extensive microservice system requires a highly reliable network that can withstand a variety of traffic. Our traffic ranges from long-lived TCP connections to special MapReduce tasks and incredibly short microbursts. Initially, to deploy this variety of traffic types, we deployed network equipment with deep packet buffers, but because of this, we had our own problems there: higher cost and increased hardware complexity. Later projects used more standard buffer sizes and end-to-end switching functions along with a better-tuned server-side TCP stack for more elegant micro-burst processing.
Lessons learned
Over the years and after the improvements we made, we realized a few things worth mentioning:
- Design beyond the original specifications and requirements, make bold and quick changes if the traffic approaches the upper boundary of the capacity laid in the network.
- Rely on data and metrics to make the right technical design decisions, and make sure these metrics are clear to network operators - this is especially important on the hosting or in the cloud.
- There is no such thing as a temporary change or a workaround: in most cases, workarounds are a technical duty.
Backbone traffic
Tasks
Our backbone traffic dramatically increased every year - and we still see 3-4 times spikes from normal traffic when we move traffic between data centers. This poses unique challenges for historical protocols that were not designed for that. For example, RSVP in MPLSinvolves a certain degree of gradual increase in traffic, rather than sudden bursts. We had to spend a lot of time setting up these protocols in order to get the fastest response time. In addition, to handle traffic spikes (especially when replicating in storage systems), we implemented a priority system. Although we always need to guarantee the delivery of user traffic, we can allow the delay of low-priority replication traffic from storage systems with daily SLAs. Thus, our network uses all available bandwidth and uses resources as efficiently as possible. User traffic is always more important than low-priority backend traffic. In addition, to solve bin-packing problems associated with automatic throughputRSVP , we implemented the TE ++ system , which, when traffic increases, creates additional LSPs and removes them when traffic decreases. This allows us to effectively manage traffic between connections, while reducing the CPU load required to support a large number of LSPs.
Although no one initially designed traffic for the backbone, it was later added to help us scale in line with our growth. To do this, we performed the separation of roles with separate routers for routing kernel traffic and boundary traffic, respectively. It also allowed us to scale in the budget mode, since we did not need to buy routers with complex boundary functionality.
At the border, this means that here the kernel is connected to everything and can be scaled in a very horizontal way (for example, installing many, many routers in one place, and not just a couple, since the core interconnects connect everything through).
In order to scale the RIB in our routers to meet the scaling requirements, we had to implement route reflection, but having done this and moving to a hierarchical structure, we also implemented route reflector clients for their own route reflectors!
Lessons learned
Over the past year, we have transferred device configurations to templates, and now we regularly check them.
Border traffic
The global Twitter network has direct interconnects with over 3,000 unique networks in many data centers around the world. Direct traffic delivery is a top priority. We move 60% of our traffic through our global network backbone to interconnects and points of presence (POPs), where we have local front-end servers that close client sessions, all to be as close as possible to users.
Tasks
The unpredictability of world events leads to the same unpredictable bursts of traffic. These outbursts during major events like sports, elections, natural disasters and other significant events put our network infrastructure (especially photos and videos) under stress. They are difficult to predict or occur without warning at all. We provide capacity for such events and prepare for large leaps - often 3-10 times higher than normal peak levels if a significant event is planned in the region. Due to our significant annual growth, increasing capacity in the required volume is an important task.
Although we establish peer-to-peer connections with all client networks whenever possible, this is not without problems. Surprisingly often, networks or providers prefer to establish interconnects far from the home market or, because of their routing rules, direct traffic to a point of presence outside the market. And while Twitter openly establishes peer-to-peer connections with all the largest (by the number of users) networks where we see traffic, not all Internet providers do the same. We spend considerable time optimizing our routing rules to direct traffic as close to our users as possible.
Lessons learned
Historically, when someone sent a request to
www.twitter.com, based on the location of our DNS server, we gave them different regional IP addresses to direct to a specific server cluster. Such a methodology (GeoDNS) is partially inaccurate because you cannot rely on users to choose the right DNS servers or our ability to determine exactly where the DNS server is physically located in the world. In addition, the topology of the Internet does not always correspond to geography.To solve the problem, we switched to the BGP Anycast model, in which we announced the same route from all locations and optimized our routing to pave the best route from users to our points of presence. By doing so, we get the highest possible performance, taking into account the limitations of the Internet topology and are not dependent on unpredictable assumptions about where the DNS servers are located.
Storage
Hundreds of millions of tweets are published daily. They are processed, stored, cached, delivered and analyzed. For this amount of content, we need the appropriate infrastructure. Storage and messaging represent 45% of Twitter’s total infrastructure.
Storage and messaging groups provide the following services:
- Hadoop clusters for computing and HDFS.
- Manhattan clusters for all low-latency key-value stores.
- Storage Graph for shardirovannyh MySQL Cluster.
- Blobstore clusters for all large objects (videos, images, binary files ...).
- Cluster caching .
- Clusters messaging .
- Relational storage ( MySQL , PostgreSQL and Vertica ).

Tasks
Although there are a number of different problems at this level, one of the most notable ones that had to be overcome was multi-tenancy. Often, users have boundary situations that affect existing possessions and force us to build dedicated clusters. The more dedicated clusters, the greater the operational load to support them.
There is nothing surprising in our infrastructure, but here are a few interesting facts:
- Hadoop: Our many clusters store over 500 PB divided into four groups (real-time, processing, data storage, and cold storage). In the largest cluster, more than 10 thousand nodes. We have 150 thousand applications and 130 million containers a day.
- Manhattan (backend for tweets, private messages, twitter accounts, etc.): we have several clusters for different tasks, these are large clusters with multiple ownership, smaller for unusual tasks, read only and read / write clusters for heavy traffic for reading and writing. The read only cluster processes tens of millions of requests per second (QPS), while the read / write cluster processes millions of QPS. Each data center has a cluster with the highest performance - an observability cluster that processes tens of millions of records.
- Graph: our historic Gizzard / MySQL based shard cluster for graph storage. Our social graph Flock is able to cope with the peak load of tens of millions of QPS, distributing it to MySQL servers with an average of 30-45 thousand QPS.
- Blobstore: A repository for images, videos, and large files that contains hundreds of billions of objects.
- Cache: Redis and Memcache clusters cache users, timelines, tweets, etc.
- SQL: includes MySQL, PostgreSQL, and Vertica. MySQL / PosgreSQL is used where strict integrity is needed in the management of advertising campaigns, ad exchange, as well as for internal tools. Vertica is a column storage that is often used as a backend for sales with Tableau support and user organization.
Hadoop / HDFS is also the backend for the Scribe-based logging system, but the final stages of testing the transition to Apache Flume are nearing completion . It should help in overcoming restrictions, such as the absence of limits / narrowing of the band for the traffic of individual customers to aggregators, the absence of a guarantee of delivery by category. It will also help solve memory corruption problems. We process more than a trillion messages per day, all of them are processed and distributed in more than 500 categories, combined, and then selectively copied across our clusters.
Chronological evolution
Twitter was built on MySQL and initially all the data was stored in it. We moved from a small database to a large instance, and then to a large number of large database clusters. Moving data between MySQL instances manually was time consuming, so in April 2010 we introduced Gizzard , a framework for creating distributed data warehouses.
At that time, the ecosystem looked like this:
- Replicated MySQL clusters.
- Gizdard-based MySQL shared clusters.
Following the release of Gizzard in May 2010, we introduced FlockDB , a solution for storing graphs on top of Gizzard and MySQL, and in June 2010, Snowflake , our unique identifier matching service. 2010 was the year we invested in Hadoop . Originally designed to store MySQL backups, it is now heavily used for analytics.
Around 2010, we also introduced Cassandra as a data storage solution, and although it did not completely replace MySQL due to the lack of a function of automatic gradual increase, we began to use it for storing indicators. As traffic increased exponentially, we needed to increase the cluster, so in April 2014 we launched Manhattan: our multi-tenant distributed real-time database. Since then, Manhattan has become one of our primary storage levels, and Cassandra has been disabled.
In December 2012, Twitter allowed the upload of photos. Behind the façade, this is made possible by the new Blobstore storage solution .
Lessons learned
Over the years, as the data migrated from MySQL to Manhattan to improve accessibility, reduce latency and easier development, we have also implemented additional data storage engines (LSM, b + tree ...) to better serve our traffic patterns. In addition, we learned from the incidents and began to protect our data storage levels from abuse by sending back a pressure signal and activating query filtering.
We continue to concentrate on providing the right tool for the job, but for this we need to understand all the use cases. A universal solution such as “one size fits all” rarely works - you should avoid cutting corners in boundary situations, because there is nothing more permanent than a temporary solution. Lastly, do not overestimate your decision. Everything has advantages and disadvantages, and everything needs to be adapted without losing touch with reality.
Cache
Although the cache occupies only about 3% of our infrastructure, it is critical for Twitter because it protects our backend repositories from heavy read traffic and also allows you to store objects with high swelling costs. We use several caching technologies, like Redis and Twemcache, on a massive scale. More specifically, we have a mixture of Twitter memcached (twemcache) clusters, dedicated or multi-tenant clusters, as well as Nighthawk clusters (shaded by Redis). We have migrated almost all of our primary bare metal caching to Mesos to reduce operating costs.
Tasks
Scaling and performance are key tasks for the caching system. We have hundreds of clusters with an aggregate packet transfer rate of 320 million packets per second, delivering 120 GB / s to our customers, and we aim to provide every response with a delay of between 99.9% and 99.99% even during peak traffic jumps. during significant events.
To meet our service level objectives (SLO) in terms of high throughput and low latency, you need to continuously measure the performance of our systems and look for options to optimize efficiency. To this end, we wrote the rpc-perf programIt helps you better understand how our caching systems behave. This is critical for capacity planning, as we switched from dedicated servers to the current Mesos infrastructure. As a result of this optimization, it was possible to more than double the bandwidth per server without sacrificing latency. We still think that big optimizations are possible here.
Lessons learned
Switching to Mesos was a huge operational victory. We have codified our configurations and can gradually deploy them, maintaining the cache hit ratio and avoiding problems for persistent data storages. The growth and scaling of this level occurs with greater confidence.
With thousands of connections per twemcache instance, any restart of the process, a surge in network traffic or other problems can cause a DDoS-like influx of connections to the cache level. As it scales, this has become more than a serious problem. We implemented benchmarks that help in the case of DDoS to narrow the bandwidth for connections to each individual cache with a high level of reconnect, otherwise we would deviate from our stated goals in terms of service.
We logically split our caches by users, tweets, timelines, etc., so that in general each caching cluster is configured for a specific use. Depending on the type of cluster, it can process from 10 million to 50 million QPS, and runs on the number of instances from hundreds to thousands.
Haplo
Let us introduce Haplo. This is the main cache for Twitter timelines and it runs on a customized version of Redis (using HybridList). Read operations from Haplo are performed by the Timeline Service, and write operations by the Timeline Service and Fanout Service. This is also one of our caches that have not migrated to Mesos yet.
- The total number of teams from 40 million to 100 million per second.
- 100 Mbps network I / O per host.
- The total number of service requests is 800 thousand per second.
For further reading
Yao Yue ( @thinkingfish ) has delivered some excellent lectures over the years and published several articles on caching, including our use of Redis , as well as our newer Pelikan code base . You can watch these videos and read a recent blog post .
Puppet work on a large scale
We have a large array of core infrastructure services, such as Kerberos, Puppet, Postfix, Bastions, Repositories, and Egress Proxies. We focus on scaling, creating tools and managing these services, as well as supporting the expansion of data centers and points of presence. Last year alone, we significantly expanded the geography of our points of presence, which required a complete alteration of the architecture of how we plan, prepare and launch new locations.
To manage all configurations, we use Puppet and install an initial batch installation on our systems. This section describes some of the tasks that we had to solve and what we plan to do with our configuration management infrastructure.
Tasks
As we grow to meet user needs, we quickly outgrew standard tools and practices. We have more than 100 authors of commits per month, more than 500 modules and more than 1000 roles. Ultimately, we were able to reduce the number of roles, modules, and lines of code, while at the same time improving the quality of our code base.
Branches
We have three branches that Puppet refers to as environments. This allows you to properly test, run in and eventually release changes to the working environment. We also allow separate specialized environments for more isolated testing.
Transferring changes from the test to the working environment at the moment requires some human involvement, but we are moving to a more automated CI system with an automated integration / rollback process.
Code base
Our Puppet repository contains more than 1 million lines of code, where only Puppet code is more than 100 thousand lines in each branch. We recently performed a massive cleanup of the code base, removing unnecessary and duplicate code.
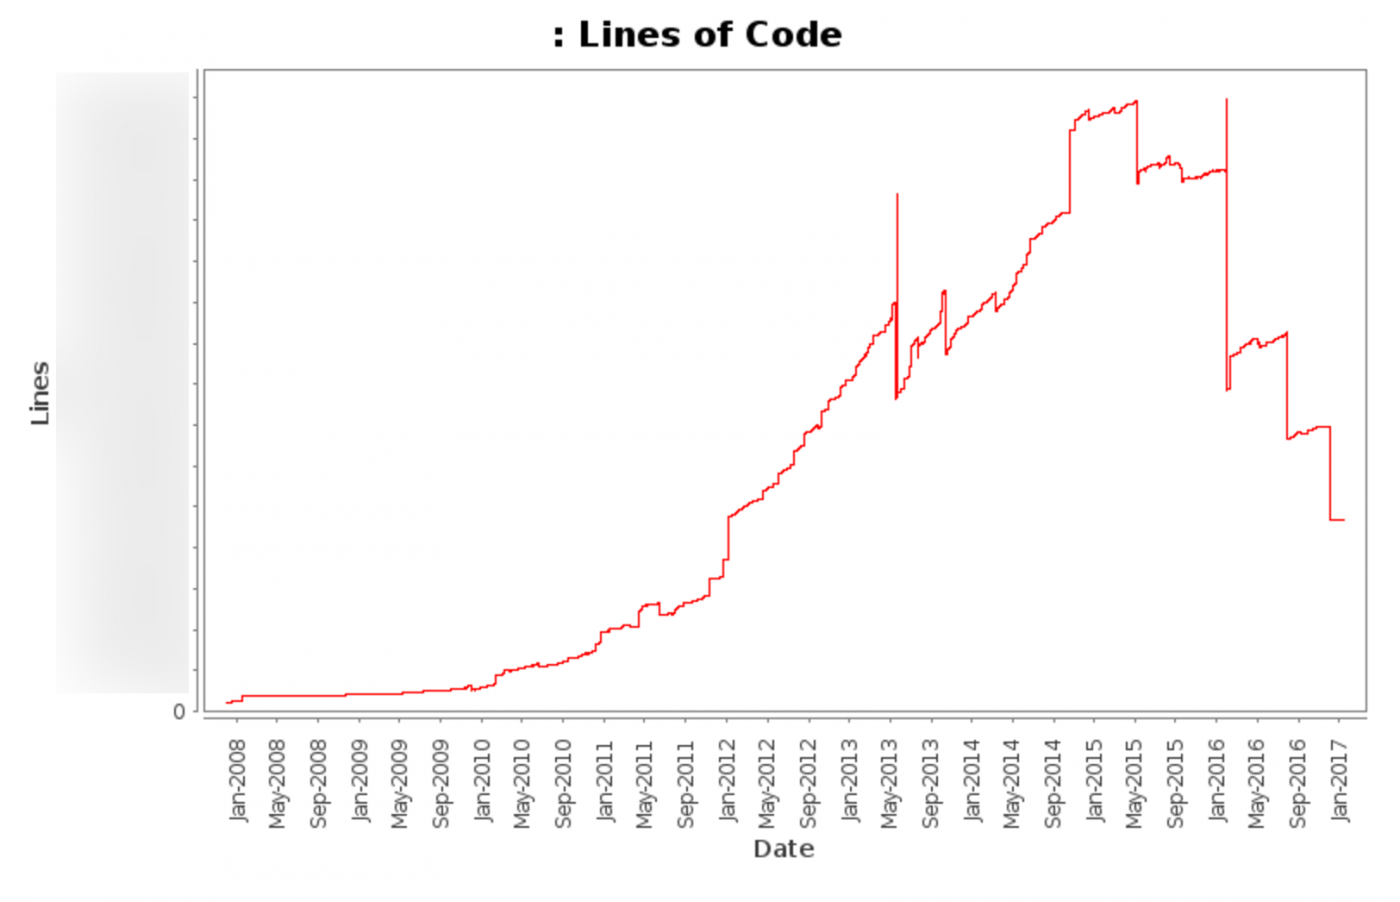
This graph shows the total number of lines of code (excluding various automatically updated files) from 2008 to today.

This graph shows the total number of files (excluding various automatically updated files) from 2008 to today.
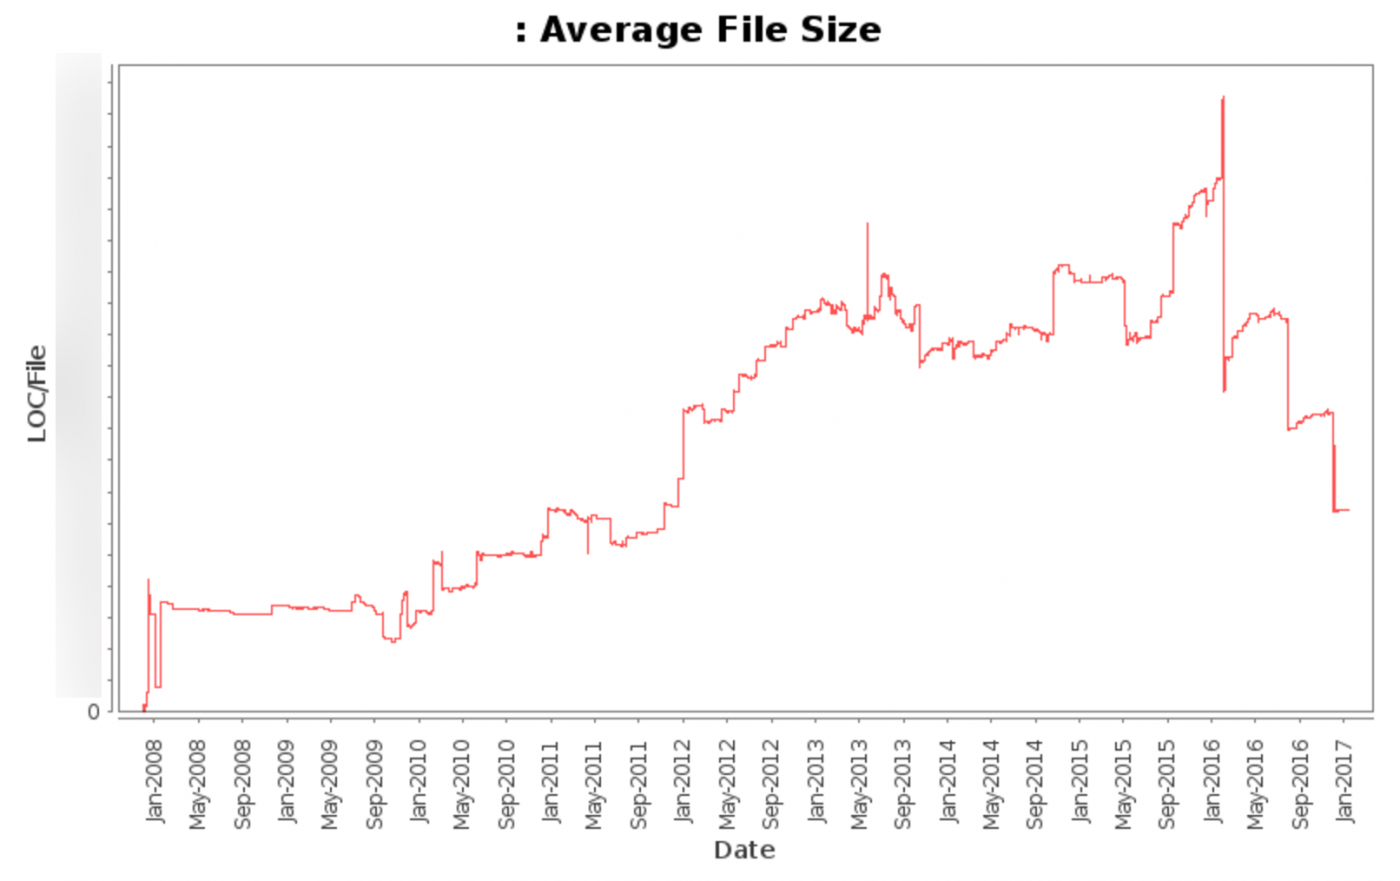
This graph shows the average file size (excluding various automatically updated files) from 2008 until today.
Big wins
The biggest victories for our code base were static code analysis (linting), style-checking hooks, documentation of best practices, and regular workshops.
With puppet-lint tools, we were able to meet generally accepted standards for linting. We reduced the number of linting errors and warnings in our code base by tens of thousands of lines, and the conversions affected 20% of the code base.
After the initial cleanup, it has now become easier to make smaller changes to the code base, and the introduction of automated style checking as a hook for version control has dramatically reduced the number of style errors in our code base.
With over a hundred commit writers at Puppet throughout the organization, the importance of documenting best practices, both internal practices and community standards, is growing. Having a single reference document improved the quality of the code and the speed of its implementation.
Holding regular support meetings (sometimes by invitation) helps to provide one-on-one assistance when the tickets and channel in the chat do not provide sufficient communication density or cannot reflect the full picture of what needs to be achieved. As a result, after the meetings, many commit authors improved the quality of the code and the speed of work, understanding the requirements of the community, best practices and how best to apply the changes.
Monitoring
System indicators are not always useful (see Caitlin McCaffrey's lecture at Monitorama 2016), but they provide an additional context for those indicators that we find useful.
Some of the most useful metrics for generating alerts and charts are:
- Failures: Number of failed Puppet starts.
- Duration: The amount of time that the Puppet client takes to complete the job.
- Lack of work: the number of Puppet starts that did not take place in the expected interval.
- Directory Sizes: The size of directories in megabytes.
- Directory compilation time: time in seconds that the directory needs to compile.
- Number of directories compiled: the number of directories that each master has compiled.
- File Resources: The number of files processed.
All these indicators are collected for each host and summarized by role. This allows you to instantly issue alerts and determine if there is a problem for specific roles, role sets, or wider issues.
the effect
After switching from Puppet 2 to Puppet 3 and updating Passenger (we will post posts on both topics later), we were able to reduce the average running time of Puppet processes in Mesos clusters from more than 30 minutes to less than 5 minutes.

This graph shows the average Puppet process run time in seconds in our Mesos clusters.
If you want to help with our Puppet infrastructure, we invite you to work !