Instana application monitoring system overview
Today I will tell you what Instana is and how this monitoring system (SM) differs from others.
 The system consists of Instana Backend (a server with a web interface and a storage of collected data) and Instana Agent (an agent that is installed on target hosts for monitoring applications). Cassandra is used as a database for storing metric data . In addition to the On-premise installation, there is a cloud version. The review is devoted to the experience of using the first option.
Technical details and documentation links are under the spoiler.
Despite the fact that the system interface is very intuitive, I advise you to read the relevant documentation , there are non-obvious points.
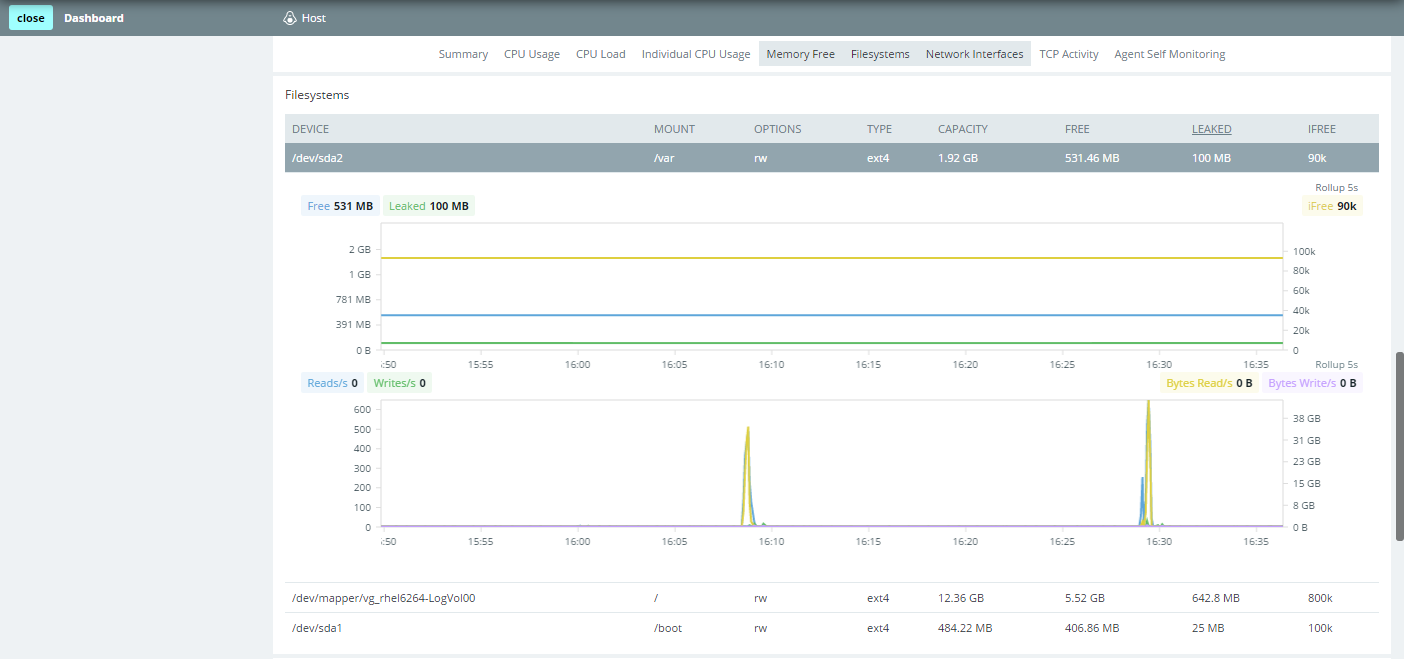
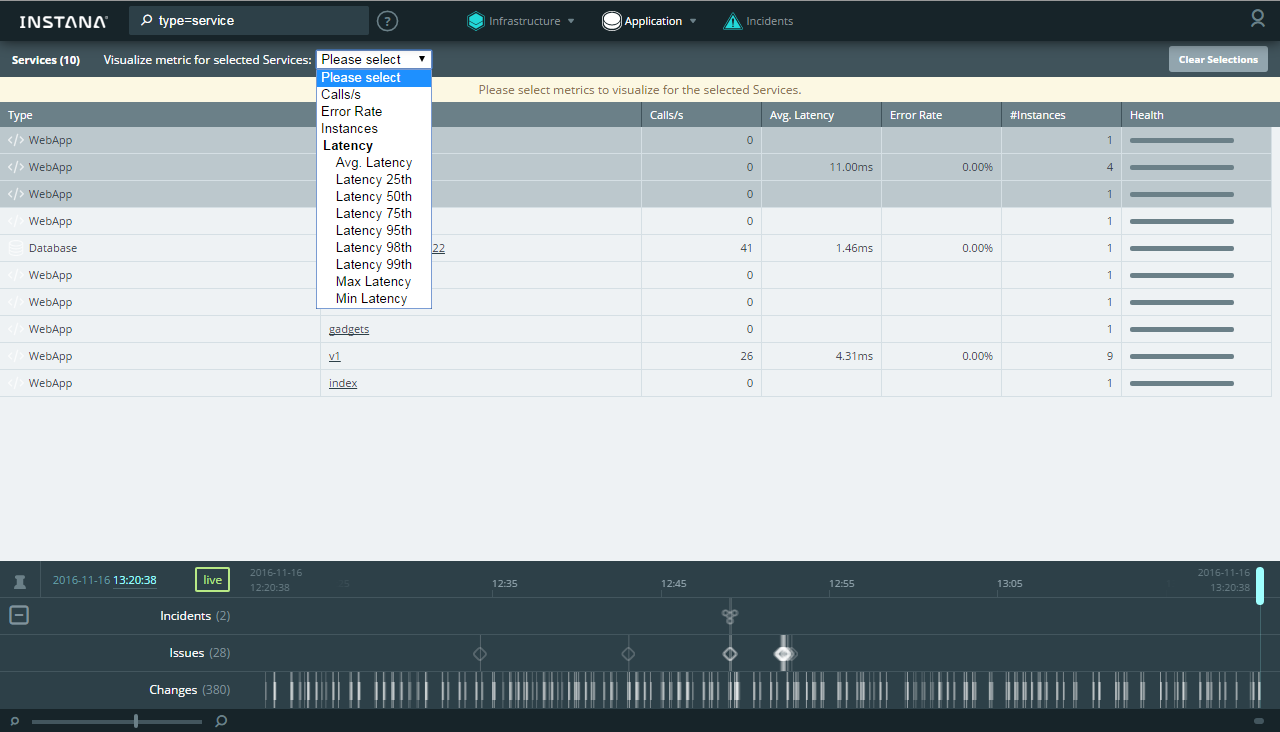
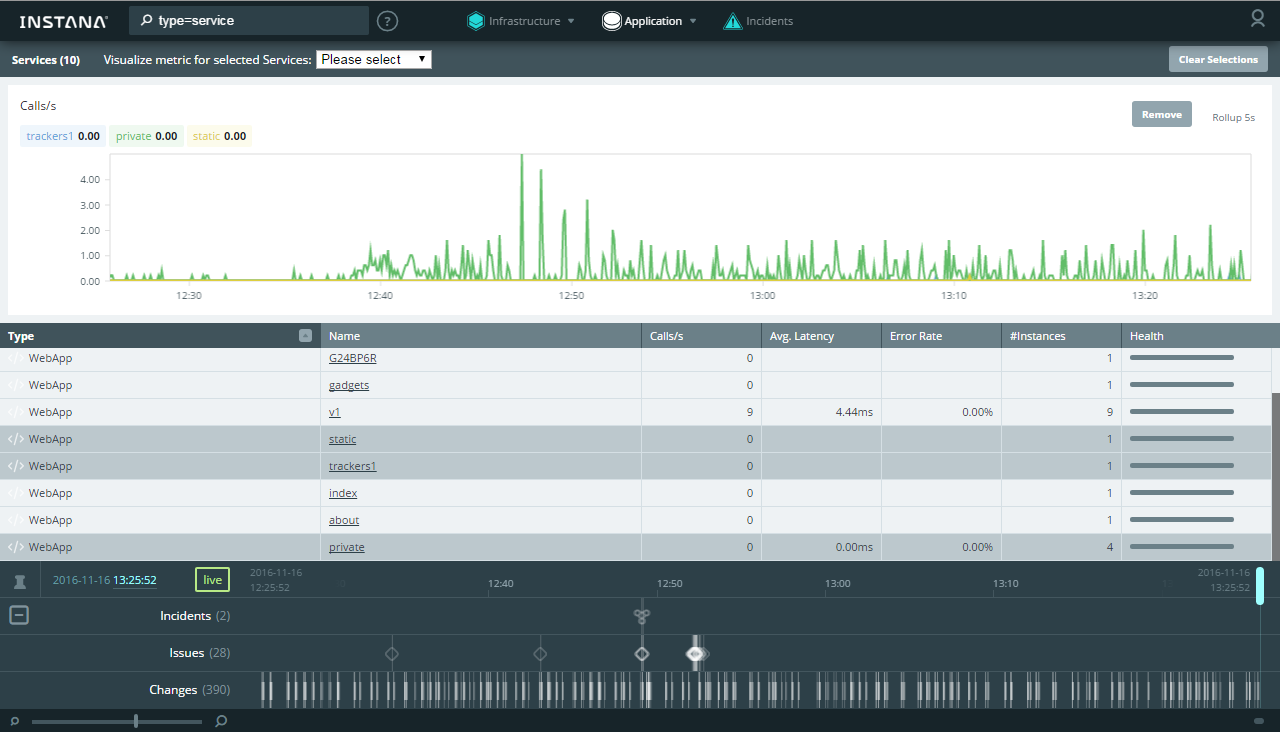
For example, to see the details of a particular parameter, you need to click on it (for me, the row of the table was not an obvious place to click):
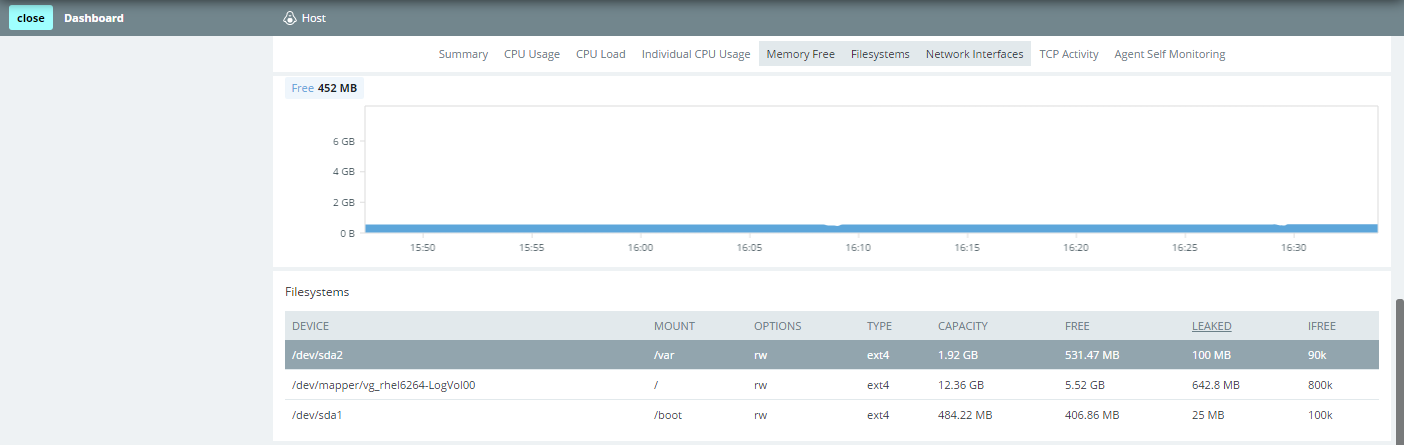
The corresponding chart will open:
Infrastructure Map ( Infrastructure the Map ):
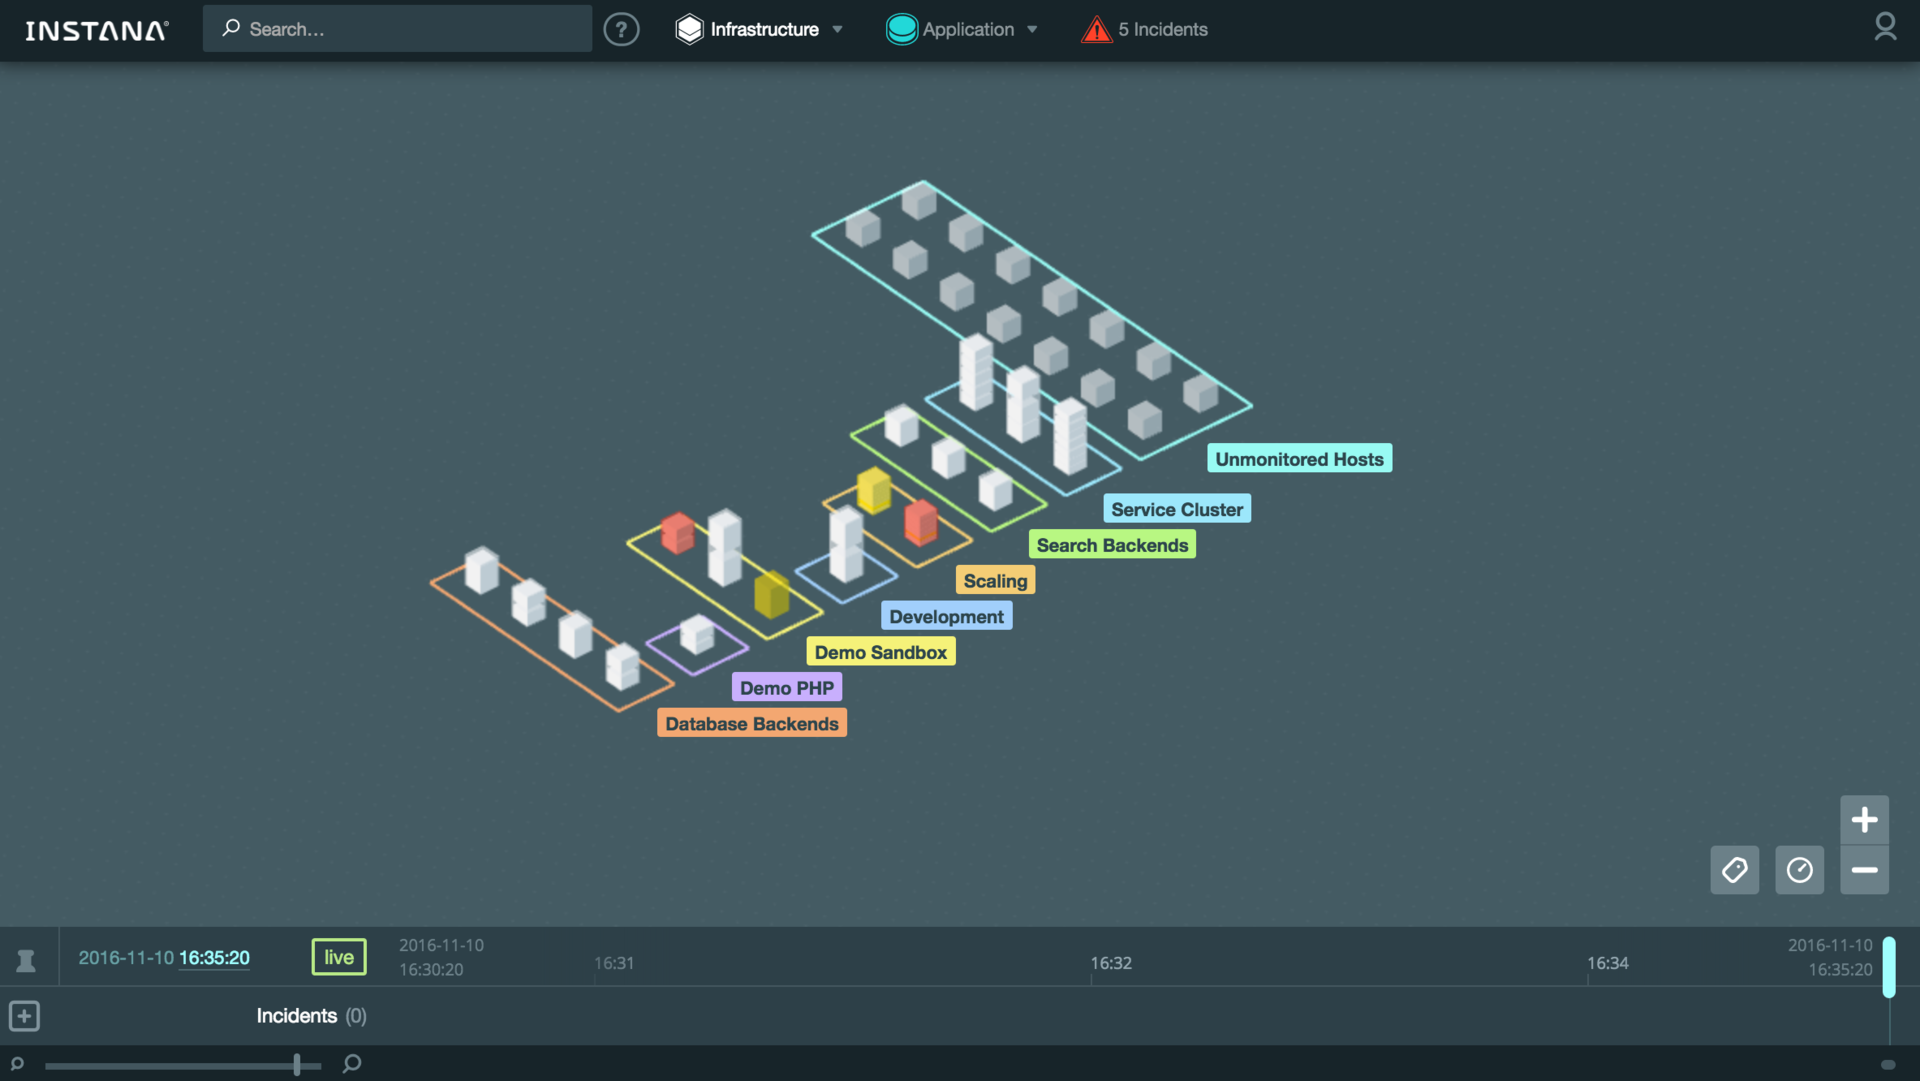
You can enable the display of system metric values (CPU, memory) directly on the map:
In the new version, a comparison table has been added. It allows you to immediately see the current value of the main system metrics for all hosts. In addition, you can quickly select the necessary hosts and analyze an arbitrary metric on the summary chart:
Map application ( the Application the Map ):

In the new version, a comparison table has been added for application components, where you can also select components and analyze them on a summary chart:
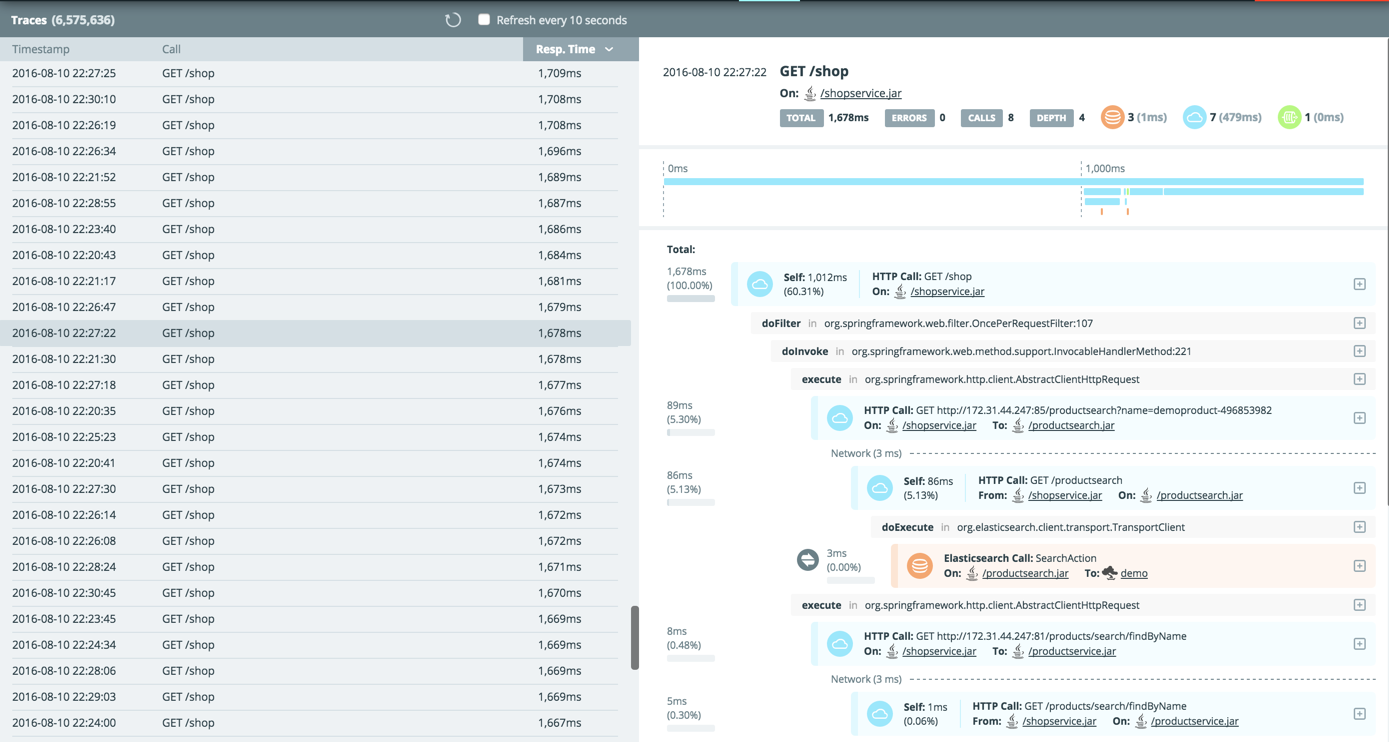
All transactions are available for analysis in the Trace view , where the table is sorted by any column (for example, you can quickly find the longest transaction):
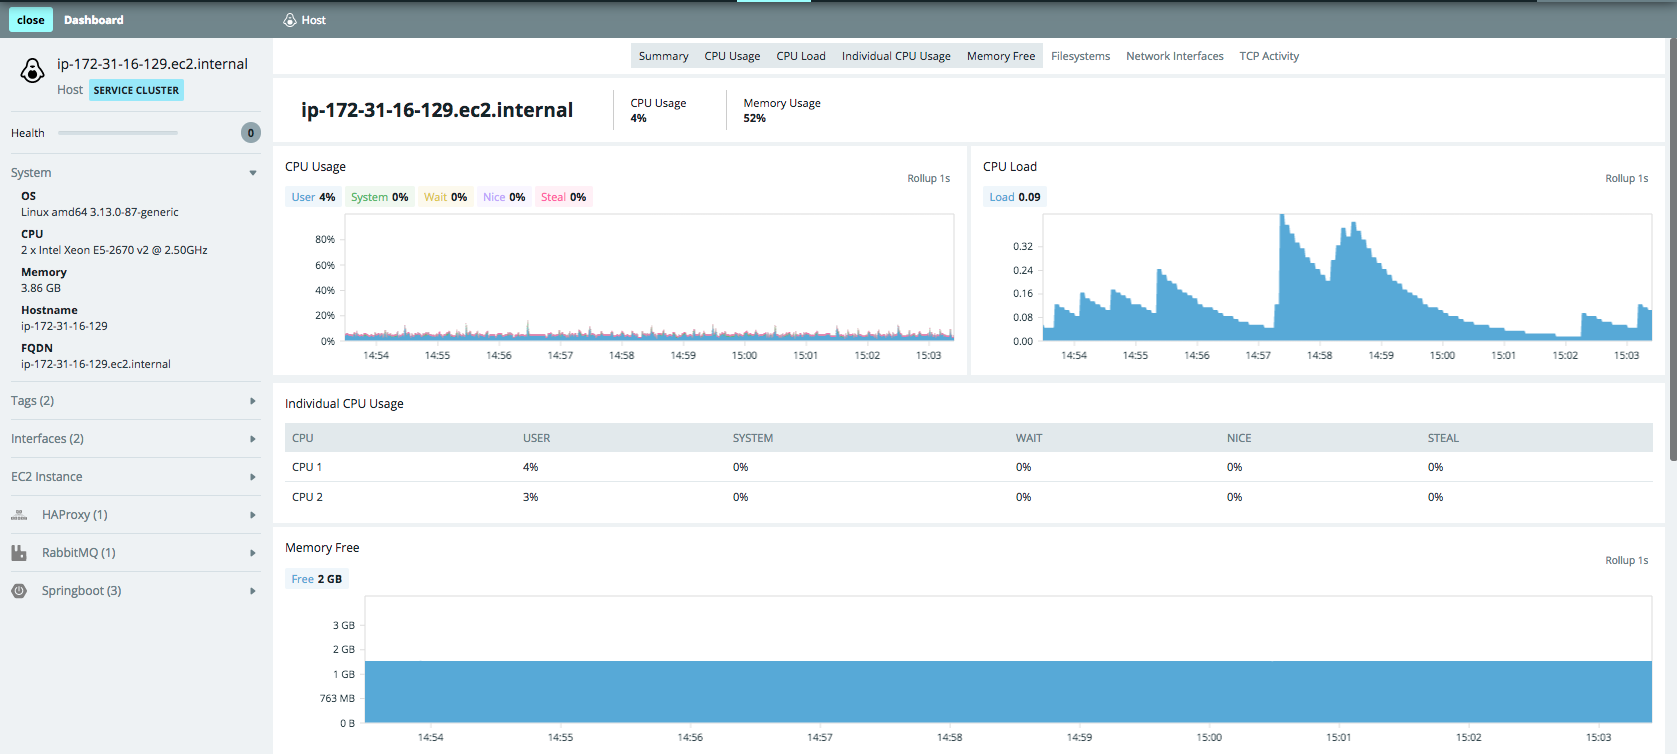
From any view, you can open the dashboard, in which you will find graphs and metric values for the host and components on it:
There is a search by hostnames, components, trace, tags, zones - masks (*) and unions (AND / OR) are supported:

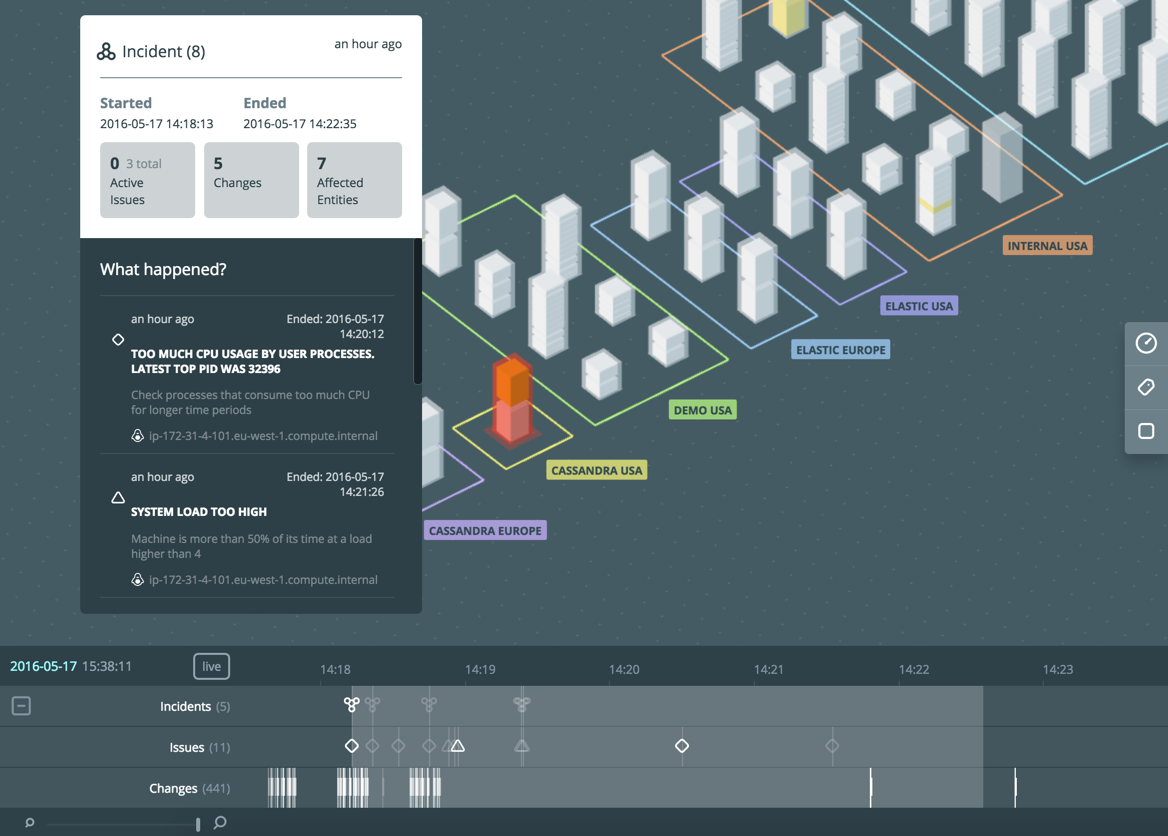
A distinctive feature that no other SM currently has is its work with historical data in Timeshift mode . When scrolling through the Timeline, we see not only all the events in the past time, but also what the map (physical / logical) looked like in the past. For example, it can be seen that Tomcat stopped working on the server, how it affected the interaction of application components, as the infrastructure map and the application component map looked like before. In the same vein, you can watch transactions (tab Application → Trace ).
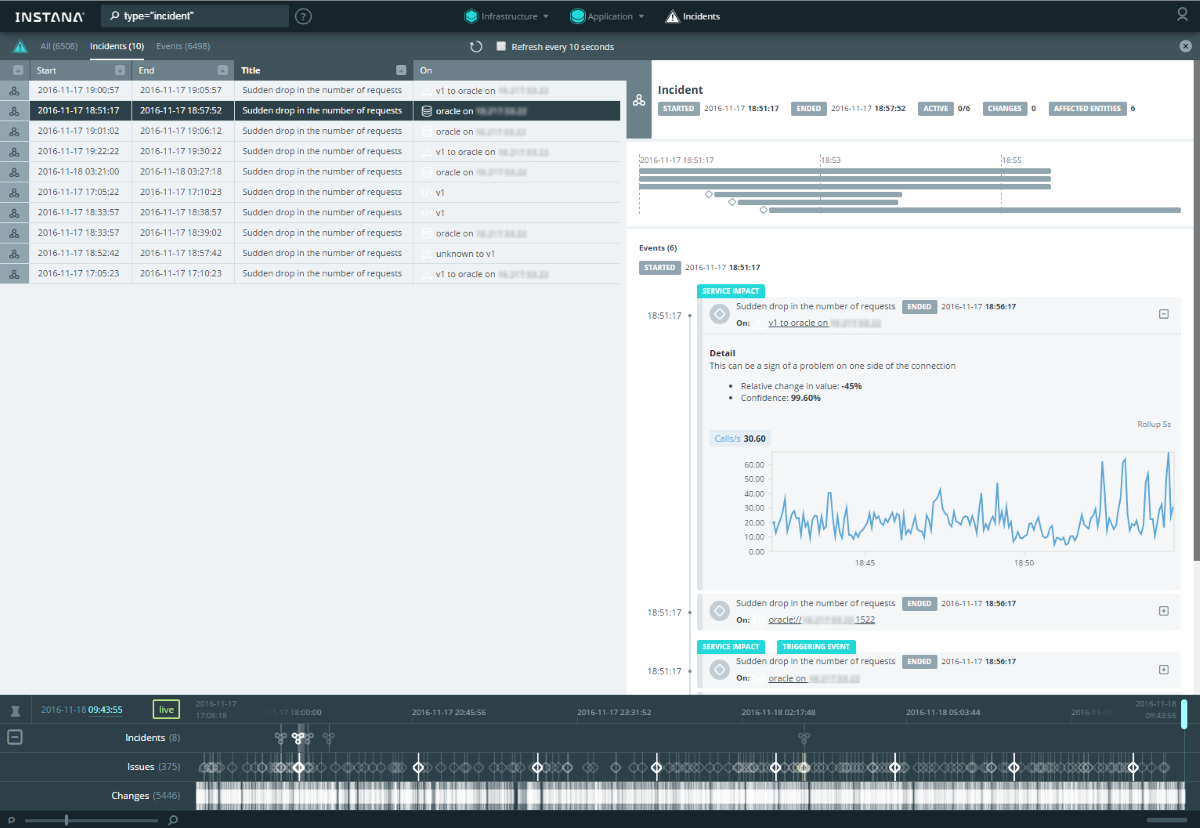
In the new version of the backend, all events are collected in a separate Incidents tab, where you can sort the table by columns and analyze details:
Using the links in details, you can immediately go to the detailed dashboard of the corresponding component.
Unlike classical infrastructure monitoring (host availability, CPU utilization level, availability of an HTTP page, etc.), application monitoring has more serious requirements for the frequency and granularity of the data being collected. The more often we get the value of a particular metric, the better, especially with regard to transactional monitoring. This is due to the fact that problems with the application can be very short, and the consequences are quite noticeable. To compare graphs with different granularity (1 minute vs 5 seconds):


It is immediately clear that insufficiently detailed data in some cases will not allow to detect the problem. This system allows you to collect data with a frequency of up to 1 second . To reduce the amount of historical data, they are aggregated relative to the prescription - the further, the lower the granularity: 1 second (live data is stored 10 minutes) → 5 seconds (stored 1 day) → 1 minute (stored 31 days) → 5 minutes (stored 3 months ) → 1 hour (stored for 1 year, but can be increased). Automatic discovery of components
is very useful.: if an Instana agent is installed on the host, all components and services known to it will automatically appear in the SM. This is especially important when your application is built on microservices :

The list of supported technologies includes almost everything that is popular now. Naturally, you can watch transactions and analyze the operation of the application at the method invocation level (the documentation contains details of the trace mechanism ).
An important criterion for choosing SM for us is Scala support , which is rare for SM applications. It may seem that Java support is enough for SM - and deep monitoring of the application ( instrumentation ) in your pocket. But in fact, it turns out that this is not so: without Scala support, only one JVM call trace will be visible on monitoring. Therefore, even the most famous players in the APM market today are lagging behind in this regard.
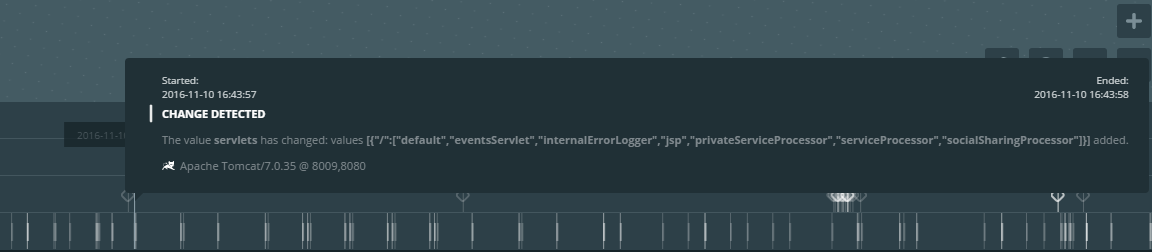
The system sees changes in components according to the delta principle :
In addition, the system is capable of displaying the state of interaction between components in online mode (the frequency of movement of points on the links shows how fast data is being exchanged):
The following integration options are available for out-of-box alerts:
The product is actively developing , but now it looks like a convenient tool for finding problems with the application both at the testing / debugging stage and for operational monitoring.
The article used materials:
Installation
Technical details and documentation links are under the spoiler.
Installation Details
Перед началом установки необходимо убедиться, что у вас открыт доступ к репозиториям Instana, так как большинство компонентов загружают необходимые пакеты и артефакты при запуске. Это касается и агента Instana. Его дистрибутив содержит только ядро агента: во время установки агент обнаруживает компоненты на целевом сервере и скачивает пакеты, необходимые для мониторинга этих компонентов. Вы можете использовать ваш внутренний репозиторий в режиме прокси (например, Sonartype Nexus).
Выберите операционку — на данный момент для установки бэкенд-сервера поддерживаются:
Требования к версиям ОС обусловлены тем, что ПО Instana работает на Docker >= 1.10.
ПО платное, поэтому вам также понадобится ключ активации для Backend и Agent.
Мы используем CentOS 7, установка прошла четко по инструкции.
Добавляем запись о репозитории (используется логин/пароль, выделенный вендором):
После чего запускаем установку пакета через yum:
После окончания установки не торопитесь запускать, сперва надо скопировать и поправить конфиг для Instana Backend:
Нам понадобилось закомментировать строчку в /etc/sudoers с помощью команды visudo, чтобы произвести запуск из под root с помощью sudo:
Логинимся в репозиторий Instana:
Добавляем запуск бэкенда в автозагрузку:
Всё, теперь можно запускать:
После этого начнут загружаться необходимые пакеты из репозитория, это займет время. В конце должна появиться радостная надпись:
На данный момент поддерживаются следующие операционки:
Для запуска агента необходимо установить JDK 8 (не JRE !). Переменная среды JAVA_HOME должна содержать корректный путь к установленному JDK.
Заходим в веб-интерфейс Instana Backend и скачиваем дистрибутив под нужную операционку:

Также можно скачать дистрибутивы напрямую на сайте вендора.
Например, на Linux установка агента заключается в копировании и распаковке архива. Перед запуском необходимо поправить конфиг агента и указать данные вашего репозитория. Теперь можно запустить агента:
После запуска можно проверить статус агента командой:
При необходимости остановить агента можно командой:
Текущий лог агента лежит здесь:
Чтобы все хосты у вас на карте были разбиты на зоны (как на картинке ниже), искались по тегам, необходимо внести правки в конфиг агента на хосте и перезапустить агента. Всё это подробно описано в документации. Кстати, для начала можно установить агента на сам сервер Backend Instana.
Агента также можно установить в контейнере.
Training
Перед началом установки необходимо убедиться, что у вас открыт доступ к репозиториям Instana, так как большинство компонентов загружают необходимые пакеты и артефакты при запуске. Это касается и агента Instana. Его дистрибутив содержит только ядро агента: во время установки агент обнаруживает компоненты на целевом сервере и скачивает пакеты, необходимые для мониторинга этих компонентов. Вы можете использовать ваш внутренний репозиторий в режиме прокси (например, Sonartype Nexus).
Выберите операционку — на данный момент для установки бэкенд-сервера поддерживаются:
- SLES: >= 12
- Ubuntu: >= 16.04
- Debian: >= 8
- RedHat Enterprise Linux >= 7.2
- CentOS >= 7
Требования к версиям ОС обусловлены тем, что ПО Instana работает на Docker >= 1.10.
ПО платное, поэтому вам также понадобится ключ активации для Backend и Agent.
Установка Backend
Мы используем CentOS 7, установка прошла четко по инструкции.
Добавляем запись о репозитории (используется логин/пароль, выделенный вендором):
sudo tee /etc/yum.repos.d/instana.repo <<-EOF
[instanarepo]
name=InstanaRepositorybaseurl=https://<user>:<password>@package-repository.instana.io/backend/rhel7
enabled=1
gpgcheck=1
gpgkey=https://<user>:<password>@package-repository.instana.io/instana.gpg
EOF
После чего запускаем установку пакета через yum:
yum install instana-backend
После окончания установки не торопитесь запускать, сперва надо скопировать и поправить конфиг для Instana Backend:
cd /etc/instana-backend
cp instana.settings.template instana.settings
Нам понадобилось закомментировать строчку в /etc/sudoers с помощью команды visudo, чтобы произвести запуск из под root с помощью sudo:
#Defaults requirettyЛогинимся в репозиторий Instana:
docker login -u ”$INSTANA_REPO_USER”  -p “$INSTANA_REPO_PASSWORD” registry-
public.instana.io
Добавляем запуск бэкенда в автозагрузку:
systemctl enable instana-backend.service
Всё, теперь можно запускать:
systemctl start instana-backend
После этого начнут загружаться необходимые пакеты из репозитория, это займет время. В конце должна появиться радостная надпись:
All done :)
Установка агента
На данный момент поддерживаются следующие операционки:
- Linux 32 / 64 bit
- Windows 32 / 64 bit
- Mac OS 64 bit
Для запуска агента необходимо установить JDK 8 (не JRE !). Переменная среды JAVA_HOME должна содержать корректный путь к установленному JDK.
Заходим в веб-интерфейс Instana Backend и скачиваем дистрибутив под нужную операционку:
Также можно скачать дистрибутивы напрямую на сайте вендора.
Например, на Linux установка агента заключается в копировании и распаковке архива. Перед запуском необходимо поправить конфиг агента и указать данные вашего репозитория. Теперь можно запустить агента:
<instana-agent-install-dir>/instana-agent/bin/startПосле запуска можно проверить статус агента командой:
<instana-agent-install-dir>/instana-agent/bin/status
При необходимости остановить агента можно командой:
<instana-agent-install-dir>/instana-agent/bin/stop
Текущий лог агента лежит здесь:
<instana-agent-install-dir>/instana-agent/data/log/agent.logЧтобы все хосты у вас на карте были разбиты на зоны (как на картинке ниже), искались по тегам, необходимо внести правки в конфиг агента на хосте и перезапустить агента. Всё это подробно описано в документации. Кстати, для начала можно установить агента на сам сервер Backend Instana.
Агента также можно установить в контейнере.
Using
Despite the fact that the system interface is very intuitive, I advise you to read the relevant documentation , there are non-obvious points.
For example, to see the details of a particular parameter, you need to click on it (for me, the row of the table was not an obvious place to click):
The corresponding chart will open:
Infrastructure Map ( Infrastructure the Map ):
You can enable the display of system metric values (CPU, memory) directly on the map:
In the new version, a comparison table has been added. It allows you to immediately see the current value of the main system metrics for all hosts. In addition, you can quickly select the necessary hosts and analyze an arbitrary metric on the summary chart:
Map application ( the Application the Map ):
In the new version, a comparison table has been added for application components, where you can also select components and analyze them on a summary chart:
All transactions are available for analysis in the Trace view , where the table is sorted by any column (for example, you can quickly find the longest transaction):
From any view, you can open the dashboard, in which you will find graphs and metric values for the host and components on it:
There is a search by hostnames, components, trace, tags, zones - masks (*) and unions (AND / OR) are supported:
A distinctive feature that no other SM currently has is its work with historical data in Timeshift mode . When scrolling through the Timeline, we see not only all the events in the past time, but also what the map (physical / logical) looked like in the past. For example, it can be seen that Tomcat stopped working on the server, how it affected the interaction of application components, as the infrastructure map and the application component map looked like before. In the same vein, you can watch transactions (tab Application → Trace ).
In the new version of the backend, all events are collected in a separate Incidents tab, where you can sort the table by columns and analyze details:
Using the links in details, you can immediately go to the detailed dashboard of the corresponding component.
Unlike classical infrastructure monitoring (host availability, CPU utilization level, availability of an HTTP page, etc.), application monitoring has more serious requirements for the frequency and granularity of the data being collected. The more often we get the value of a particular metric, the better, especially with regard to transactional monitoring. This is due to the fact that problems with the application can be very short, and the consequences are quite noticeable. To compare graphs with different granularity (1 minute vs 5 seconds):
It is immediately clear that insufficiently detailed data in some cases will not allow to detect the problem. This system allows you to collect data with a frequency of up to 1 second . To reduce the amount of historical data, they are aggregated relative to the prescription - the further, the lower the granularity: 1 second (live data is stored 10 minutes) → 5 seconds (stored 1 day) → 1 minute (stored 31 days) → 5 minutes (stored 3 months ) → 1 hour (stored for 1 year, but can be increased). Automatic discovery of components
is very useful.: if an Instana agent is installed on the host, all components and services known to it will automatically appear in the SM. This is especially important when your application is built on microservices :
The list of supported technologies includes almost everything that is popular now. Naturally, you can watch transactions and analyze the operation of the application at the method invocation level (the documentation contains details of the trace mechanism ).
An important criterion for choosing SM for us is Scala support , which is rare for SM applications. It may seem that Java support is enough for SM - and deep monitoring of the application ( instrumentation ) in your pocket. But in fact, it turns out that this is not so: without Scala support, only one JVM call trace will be visible on monitoring. Therefore, even the most famous players in the APM market today are lagging behind in this regard.
The system sees changes in components according to the delta principle :
In addition, the system is capable of displaying the state of interaction between components in online mode (the frequency of movement of points on the links shows how fast data is being exchanged):
The following integration options are available for out-of-box alerts:
- Opsgenie
- Pager duty
- Slack
- Webhook
The product is actively developing , but now it looks like a convenient tool for finding problems with the application both at the testing / debugging stage and for operational monitoring.
References
The article used materials: