Predict user churn using the RFM method
Imagine: a phone call at three in the morning, you pick up the phone and hear a cry that no one else is using your product. Fearfully? In life, of course, everything is not so, but if you do not pay due attention to the problem of user outflow, you can find yourself in a similar situation.
We have detail told that such outflows: delve into the theory and show how to transform a neural network in a digital oracle. Specialists studio Plarium Krasnodar know another way to predict. We will talk about him.

RFM is a method used to segment customers and analyze their behavior. Based on the data obtained, you can create a loyalty program for each group, build a distribution of users and predict when they will return for shopping.
The history of RFM began in 1987, when the article Counting Your Customers was published : They Do Not . It described an analysis method based on the Pareto distribution (a two-parameter family of absolutely continuous distributions).
The model was called Pareto / NBD and considered only the user’s purchase history. In the classical interpretation, the work of this method was built on five pillars, or approximations:
The disadvantages of this model were both the high complexity of calculating the Gauss hypergeometric functions and the search for the maximum likelihood function.
In the 2003 article “Counting Your Customers” the Easy Way: An Alternative to the Pareto / NBD Model , the idea of implementing a more advanced model was published. In addition to the purchase history, it used two more parameters: frequency and prescription. Its main difference from Pareto / NBD was how the moment when the buyer left was determined.
In the classical formulation, it was assumed that the user is able to leave at any time, regardless of the frequency and pattern of his purchases in the past. The new approach is based on the hypothesis that the buyer may begin to lose interest immediately after the completion of the transaction.
This simplified the calculations and led to the beta-geometric model (BG / NBD). It uses three main parameters: recency, frequency, monetary, - and also four additional parameters: r, α, a, b (parameters a and b were added from the beta distribution ).
RFM helps you predict whether a customer will make a purchase in the future. Plarium Krasnodar specialists modified this method.
For calculations, we need an array of data about gaming sessions. It is recalculated into a matrix consisting of RFM parameters, and another four coefficients that are selected by the model in the learning process.
In the context of the game, the parameters take on the following values:
Parameters are aggregated into a matrix. Then it is loaded into the model, which calculates the probability of “life” of users - the chance that they will continue to play.
Calculations are made according to the formula:
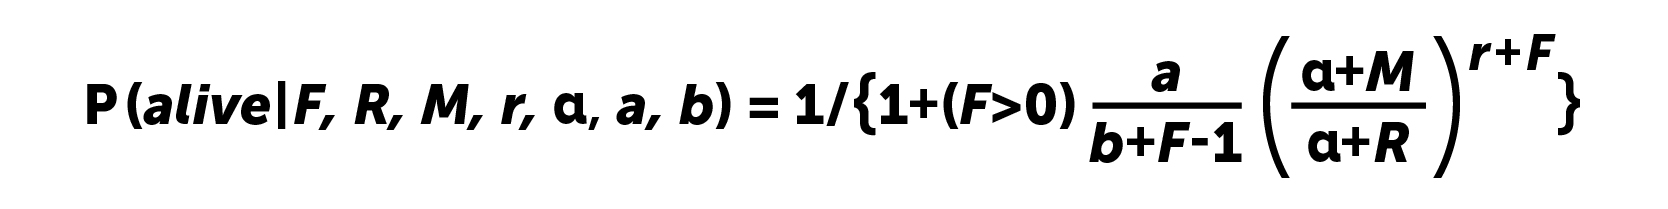
Obviously, for users without re-entering the probability of "life" will be equal to one. In 2008, the authors of the article Computing P (alive) Using the BG / NBD Model offered a solution to this problem. Game companies can use two options that give similar results.
Method 1 - for all users, the parameter π is entered. It shows which players are considered inactive.
Method 2- add one to the Frequency parameter. This measure avoids the degeneration of the formula at Frequency = 0, but artificially adds another entry to the game for each user.
Suppose we have a new user. He has just entered the game. The parameter F = 1 (or 0, depending on the calculations), since the first input is not considered, and the player has not yet had repeated ones.
The user plays for three days. Parameters change: F takes into account only the daily inputs, so its value is 2, and the indicators M and R are equal to 3. Using these data, we get the probability of "life", close to one.
The next day, the user does not enter the game. The parameter M is updated, and F and R remain the same. Substituting all the values in the formula, we see that the probability index has become lower.
If the user does not play during the week, then the indicator M is updated again and the probability of “life” drops even more.
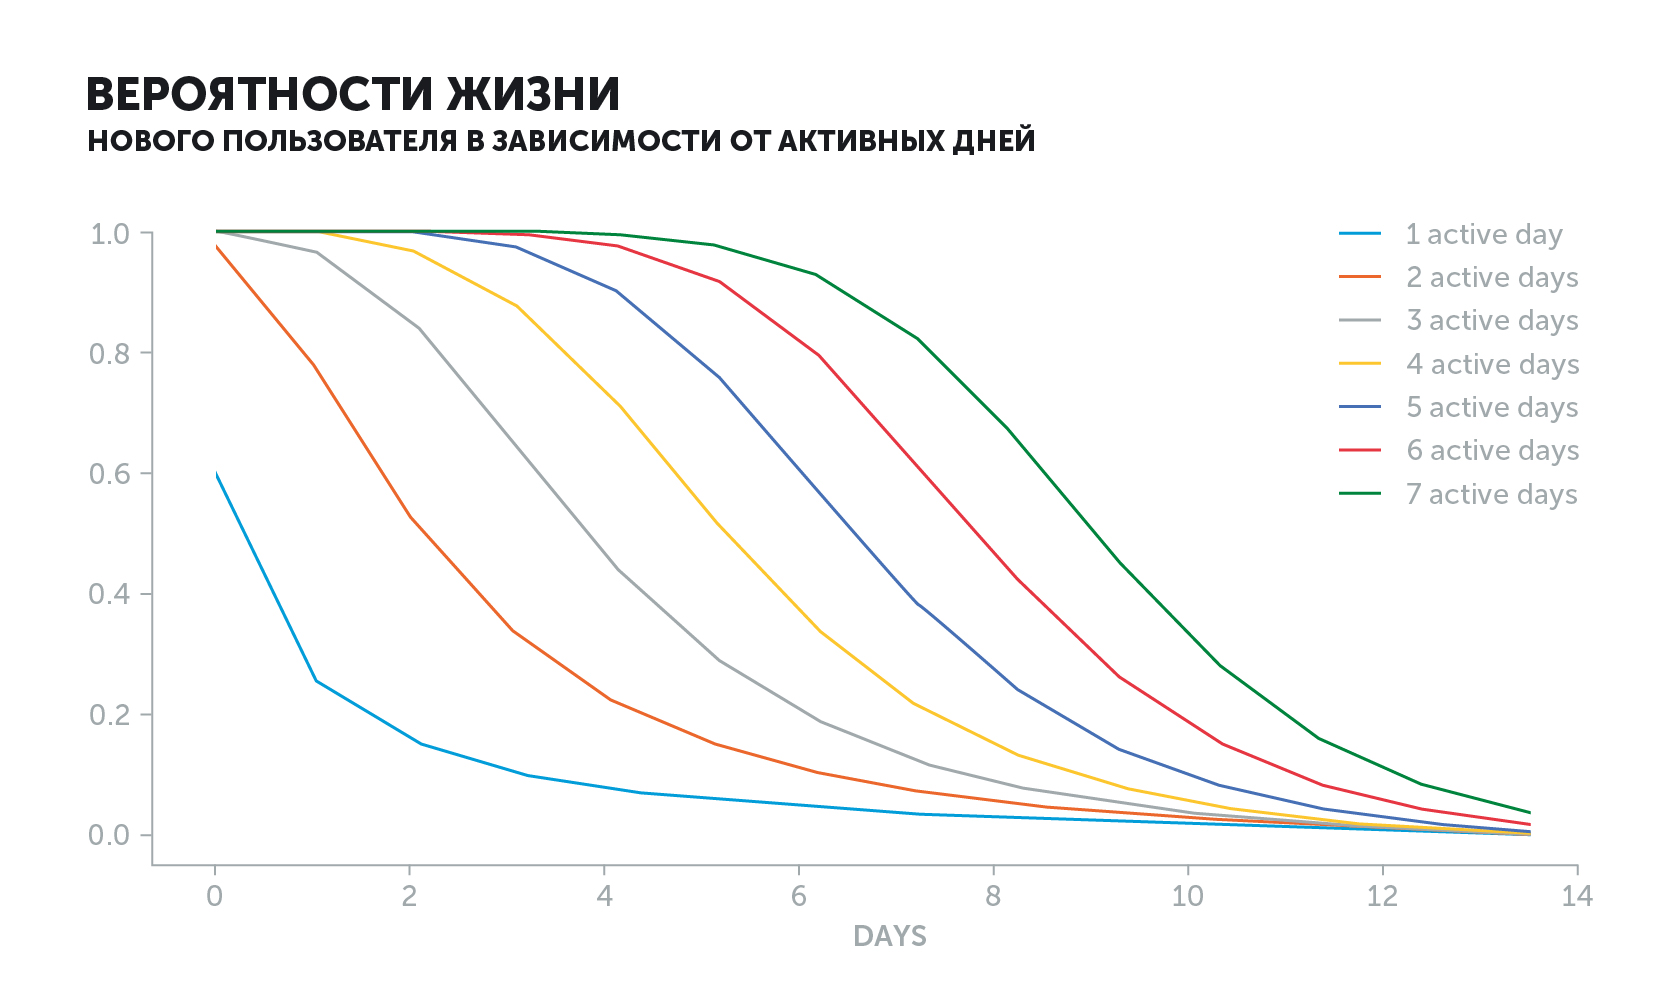
The graph of the active user looks different. The probability of "life" will decrease depending on its history. If he went into the game every day and suddenly stopped, then the value of the indicator would fall much faster than if he played every other day.

The main advantage of this method is simplicity:
In addition, RFM data is easy to interpret. Studying the user's history, you can understand why he has such a probability of "life". Often, when working with more complex methods, it is more difficult to draw concrete conclusions.
RFM also has disadvantages. First , it is not the most accurate method. It works well, but a number of parameters are not used in the calculations. For example, many users who begin to lose interest, out of habit, enter the game. That is, the average number of gaming sessions per day falls, and the frequency of repeated inputs does not change.
Secondly, the method does not take into account the user's activity: how many resources he transferred, whether he attacked the enemy, created the troops. If we take all the players with a probability of “life” equal to ~ 0.8, then, depending on the parameters and their history, besides the active ones there will be those who come every three days.
Thirdly , the left user becomes “alive” when he starts the game again. At what he can do it a month after the last entry. Such situations complicate the detection of players with long pauses between sessions. In general, this is not critical, although it introduces a certain imbalance when we try to understand whether the user is “alive” or not.
It is better, but first of all you need to understand how to implement the project: to solve large-scale tasks with a swoop or gradually move towards the goal.
RFM analysis shows the probability of the user's “life” at the moment of calculation. We can not understand, the player will leave in two or three weeks, and the neural network will be able to. Given the entire infrastructure, it is much more difficult to create such an integrated system for analyzing the players' behavior from scratch. Moreover, a baseline is needed, with which you can compare the quality of the neural network. Such an approach is likely to result in financial losses if you do not calculate the force.
Our experience shows that global tasks need to be implemented gradually. Creating a working prototype is easy, but collecting and processing data, setting up and training a neural network is another matter. These processes can take a long time, which is always lacking.
That is why we decided to first use a simpler model: we conducted research, identified the pros and cons, tried it out in our work. The results have arranged us. RFM has drawbacks, but they are generously offset by ease of use. And the neural network is the next step to improving the system.
We have detail told that such outflows: delve into the theory and show how to transform a neural network in a digital oracle. Specialists studio Plarium Krasnodar know another way to predict. We will talk about him.
This is not the RFM we need.
RFM is a method used to segment customers and analyze their behavior. Based on the data obtained, you can create a loyalty program for each group, build a distribution of users and predict when they will return for shopping.
The history of RFM began in 1987, when the article Counting Your Customers was published : They Do Not . It described an analysis method based on the Pareto distribution (a two-parameter family of absolutely continuous distributions).
The model was called Pareto / NBD and considered only the user’s purchase history. In the classical interpretation, the work of this method was built on five pillars, or approximations:
- While users are active, the number of transactions made by the buyer during the period t is subject to the distribution of Pareto with an average λt.
- The heterogeneity of the parameter λ (transaction rate) follows the gamma distribution with the parameters r and α.
- Each buyer has a boundless period of time "life" τ. The point at which the user becomes inactive is distributed exponentially with the parameter μ (dropout rate).
- The heterogeneity of the parameter μ among users follows the gamma distribution with the parameters s (shape) and β (scale).
- Parameters λ and μ can change independently among buyers.
The disadvantages of this model were both the high complexity of calculating the Gauss hypergeometric functions and the search for the maximum likelihood function.
In the 2003 article “Counting Your Customers” the Easy Way: An Alternative to the Pareto / NBD Model , the idea of implementing a more advanced model was published. In addition to the purchase history, it used two more parameters: frequency and prescription. Its main difference from Pareto / NBD was how the moment when the buyer left was determined.
In the classical formulation, it was assumed that the user is able to leave at any time, regardless of the frequency and pattern of his purchases in the past. The new approach is based on the hypothesis that the buyer may begin to lose interest immediately after the completion of the transaction.
This simplified the calculations and led to the beta-geometric model (BG / NBD). It uses three main parameters: recency, frequency, monetary, - and also four additional parameters: r, α, a, b (parameters a and b were added from the beta distribution ).
RFM helps you predict whether a customer will make a purchase in the future. Plarium Krasnodar specialists modified this method.
Predict churn simply and tastefully.
For calculations, we need an array of data about gaming sessions. It is recalculated into a matrix consisting of RFM parameters, and another four coefficients that are selected by the model in the learning process.
In the context of the game, the parameters take on the following values:
- R ecency - how long the user played at the time of the last login;
- F requency - how often the user re-entered the game;
- M onetary - how long the user plays (time of "life").
Parameters are aggregated into a matrix. Then it is loaded into the model, which calculates the probability of “life” of users - the chance that they will continue to play.
Calculations are made according to the formula:
Obviously, for users without re-entering the probability of "life" will be equal to one. In 2008, the authors of the article Computing P (alive) Using the BG / NBD Model offered a solution to this problem. Game companies can use two options that give similar results.
Method 1 - for all users, the parameter π is entered. It shows which players are considered inactive.
Method 2- add one to the Frequency parameter. This measure avoids the degeneration of the formula at Frequency = 0, but artificially adds another entry to the game for each user.
How to adapt the RFM method for game dev
Suppose we have a new user. He has just entered the game. The parameter F = 1 (or 0, depending on the calculations), since the first input is not considered, and the player has not yet had repeated ones.
The user plays for three days. Parameters change: F takes into account only the daily inputs, so its value is 2, and the indicators M and R are equal to 3. Using these data, we get the probability of "life", close to one.
The next day, the user does not enter the game. The parameter M is updated, and F and R remain the same. Substituting all the values in the formula, we see that the probability index has become lower.
If the user does not play during the week, then the indicator M is updated again and the probability of “life” drops even more.
The graph of the active user looks different. The probability of "life" will decrease depending on its history. If he went into the game every day and suddenly stopped, then the value of the indicator would fall much faster than if he played every other day.
Significant pros and non-obvious cons RFM
The main advantage of this method is simplicity:
- for calculations it is not necessary to use a complex mathematical apparatus;
- indicators are calculated using a relatively simple formula;
- You can do without complex pipelines for data;
- All optimal parameters of the model are selected automatically.
In addition, RFM data is easy to interpret. Studying the user's history, you can understand why he has such a probability of "life". Often, when working with more complex methods, it is more difficult to draw concrete conclusions.
RFM also has disadvantages. First , it is not the most accurate method. It works well, but a number of parameters are not used in the calculations. For example, many users who begin to lose interest, out of habit, enter the game. That is, the average number of gaming sessions per day falls, and the frequency of repeated inputs does not change.
Secondly, the method does not take into account the user's activity: how many resources he transferred, whether he attacked the enemy, created the troops. If we take all the players with a probability of “life” equal to ~ 0.8, then, depending on the parameters and their history, besides the active ones there will be those who come every three days.
Thirdly , the left user becomes “alive” when he starts the game again. At what he can do it a month after the last entry. Such situations complicate the detection of players with long pauses between sessions. In general, this is not critical, although it introduces a certain imbalance when we try to understand whether the user is “alive” or not.
Isn't it better to use a neural network?
It is better, but first of all you need to understand how to implement the project: to solve large-scale tasks with a swoop or gradually move towards the goal.
RFM analysis shows the probability of the user's “life” at the moment of calculation. We can not understand, the player will leave in two or three weeks, and the neural network will be able to. Given the entire infrastructure, it is much more difficult to create such an integrated system for analyzing the players' behavior from scratch. Moreover, a baseline is needed, with which you can compare the quality of the neural network. Such an approach is likely to result in financial losses if you do not calculate the force.
Our experience shows that global tasks need to be implemented gradually. Creating a working prototype is easy, but collecting and processing data, setting up and training a neural network is another matter. These processes can take a long time, which is always lacking.
That is why we decided to first use a simpler model: we conducted research, identified the pros and cons, tried it out in our work. The results have arranged us. RFM has drawbacks, but they are generously offset by ease of use. And the neural network is the next step to improving the system.