1. Check Point Log Analysis: The Official Check Point App for Splunk
- Tutorial

When working with Check Point security gateways, it often becomes necessary to parse logs to detect and analyze information security incidents. Usually in organizations there is already some kind of logging system, and the task is to transport logs from the Check Point management server and then configure filters for logs, compile dashboards, graphs, and so on. In this course, we will look at various options for analyzing Check Point logs using internal functionality and third-party applications, consider what useful information we can extract, and how it will help in setting up a firewall.
As part of Check Point's products, SmartEvent’s functionality is responsible for this, which will build reports using templates, you can also set up a limited set of automatic actions, but this is not about that, we’ll return to this issue later. There are also other solutions for this problem, which were discussed in our other articles:
Setting up all of the above solutions requires a certain amount of qualification and a lot of time for implementation. What if you want to get a solution here and now? Recently, Check Point has released an application that is ideal for this case - the Check Point App for Splunk, the data for which is sent via syslog using the log exporter tool in real time to the Splunk logging system. In this article, we will look in detail at this solution, installation, and information that we get at the output.
Installation Requirements
The Check Point management server requires the installed Log Exporter tool in order to send logs via the syslog protocol. In the GAIA R80.20 version, the Log Exporter is installed by default, but to support the Splunk log format, you need to install Jumbo Hotfix, in other versions, before installing the Log Exporter, you must first install it to support Jumbo Hotfix.
All hotfix requirements are as follows:
- R80.20 - Jumbo Hotfix Take 5 or higher;
- R80.10 - Jumbo Hotfix Take 56 or higher;
- R77.30 - Jumbo Hotfix Take 292 or higher.
For the application to work, the minimum system version must be at least Splunk 6.5, the Splunk Common Information Model (CIM) package must also be installed .
Install and Run
The installation process is quite trivial, first install the Log Exporter, then the application on Splunk, set up the process of sending logs on the management server and the adoption process in the logging system, and as a final point we start transporting the logs, check that everything works as expected. Consider all the points in more detail.
1. Install Jumbo Hotfix as required.
Go to GAIA portal in the web browser, in the left menu of Upgrades (CPUSE), Status and Actions, select the recommended Jumbo Hotfix package, which will obviously be higher than the lower threshold in the requirements, or look for the correct version in Add Hotfixes from the Cloud, install The process will require a restart of the management server.
2. Install the Log Exporter if your Check Point version is lower than R80.20.
In order to install Log Exporter on management, first download the archive from the Check Point portal .
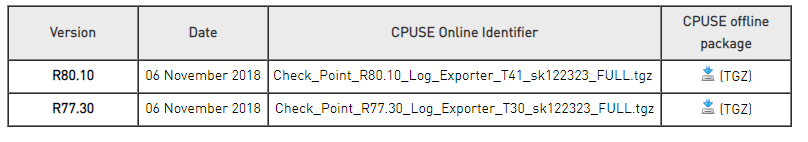
Then again we go to the CPUSE-> Status and actions menu, select Import Package, specify the path to the archive, import it. After that, we change the viewing of the Packages with Recommended packages on the Show All packages, select the imported archive, install it.
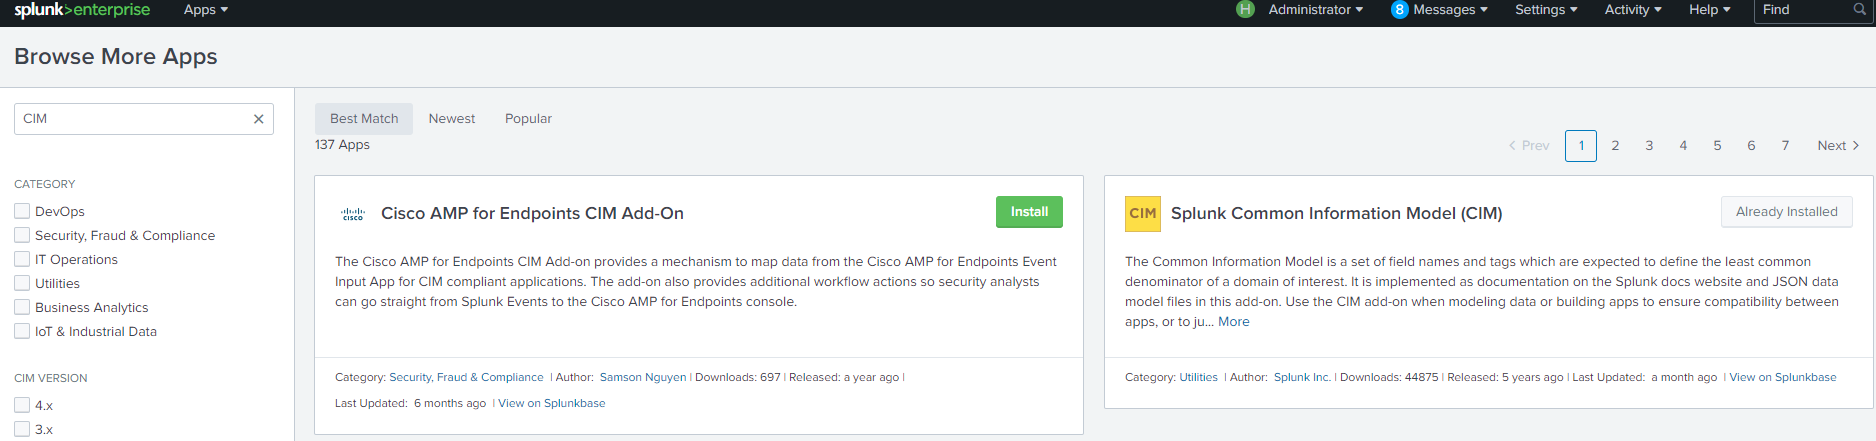
3. Install CIM if not installed before.
Go to the Splunk WebUI, find the CIM package in Manage Apps -> Browse More Apps, install.
4. Install the Check Point App for Splunk
Download the archive from the portal, then go to Splunk WebUI, Manage Apps, Install app from file, select the desired archive, click upload. Waiting for notification of successful operation, make sure that the application is now visible in the Apps list.

This is how the installed application should look like, of course, among other applications:

In order to send logs via syslog, you first need to create a Log Exporter process, then set Data Download to Splunk, and run the created process on the Check Point management server.
5. Configure Log Exporter
On the Check Point management server in the CLI, in expert mode, run the command:
cp_log_export add name [domain-server <domain-server>] target-server <target-server> target-port <target-port> protocol <tcp | udp> format splunk read-mode <raw | semi-unified>
where is the configuration name, <target-server> is the ip address of the Splunk system to which we are sending data, <target-port> is the port to which we are sending data.
Example: cp_log_export add name check_point_syslog target-server 10.10.1.159 target-port 9000 protocol tcp format splunk read-mode semi-unified
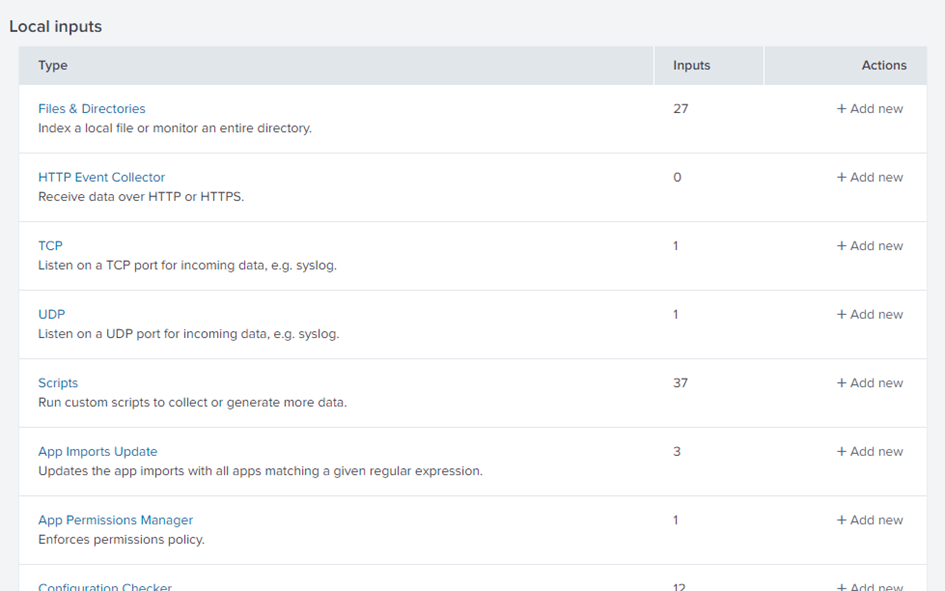
6. Configure Data Input to Splunk
Go to Splunk WebUI, select Settings from the Data section, select Data inputs.

We select the protocol on which data will go on Splunk, in this example tcp, we select + Add new.
Next, enter the port <target-port>, which was specified in the Log Exporter, in this case 9000, you can additionally specify from which ip address to accept connections, then wait for the Next button.

In the source type we specify cp_log, method - IP, index, you can leave default, all data will go to index = Main and if you have other data on this index, the search time may increase significantly, you can specify a different index or create a new one, and then in the application itself, you must directly indicate in which index the search operations are carried out.
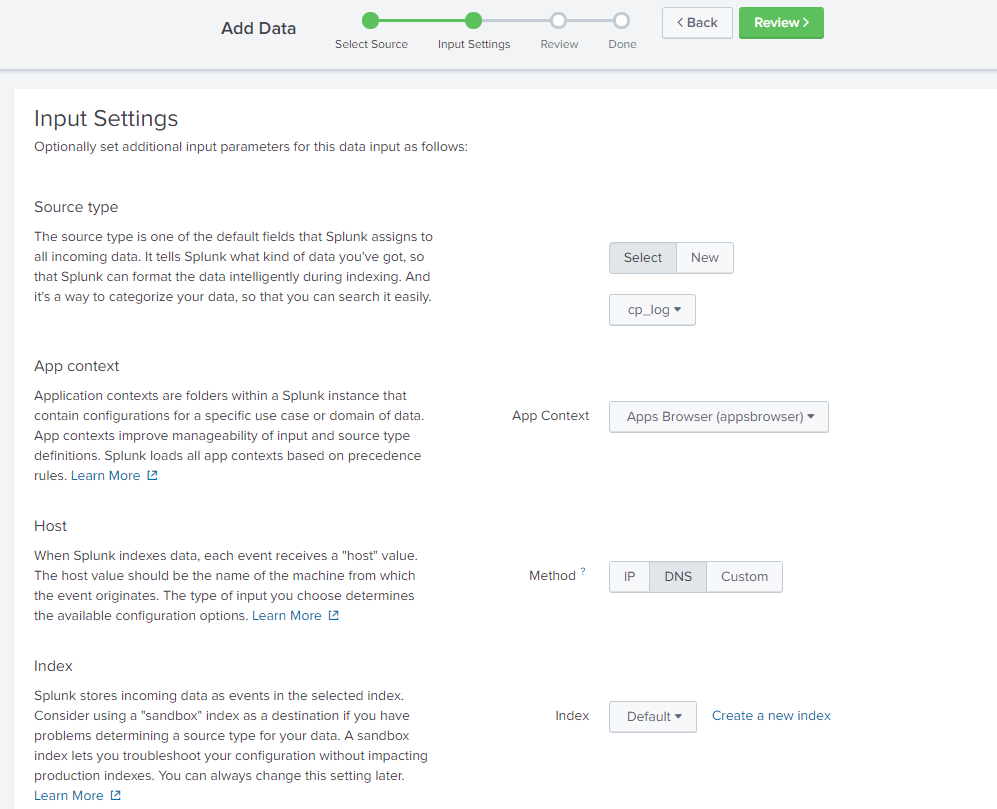
After we click Review, we see that all the settings correspond to reality, we select Submit, the Data Inputs setting is finished, all that remains is to send logs from the Check Point management server.
7. Start the process of uploading logs to Splunk
In expert mode, enter the following command:
cp_log_export restart name, where is the configuration name created in the first step
Example: cp_log_export restart check_point_syslog
Setup is completed, then all that remains is to make sure that the logs are sent to Splunk using the standard Splunk search query mechanisms.

Now you can go to the analytics of the application itself, what dashboards and reports it contains, what important information can be obtained and what conclusions can be drawn.
Log Analysis
The application is divided into 2 sections - General Overview and Threat Prevention Protection, which in turn is divided into Cyber Attack Overview, Sandblast Protection and Additional Threat Prevention Events. Consider separately each section.
General Overview The

main page of the application presents several tables, statistics and graphs. Some information in this case is basic, for example, as the number of gateways and management servers, or the number of logs by blades, most likely you will not learn anything new here, and on the basis of this information it is impossible to draw conclusions that will have a positive effect.
From my point of view, the most interesting elements here are Critical Attack Types, Critical Attacks Allowed by Policy, Infected Hosts, Allowed High Risk Applications, I will explain why.
According to information from Critical Attack Types, Critical Attacks Allowed by Policy, you can improve the Threat Prevention security policy (by translating actions from detect to prevent by specific signatures or by increasing the response level), thereby increasing the security level for protection against virus threats, intrusion attempts and hacking. infrastructure. Infected Hosts points to those users who are possibly infected, and accordingly in the future they should be separately checked by antivirus or isolated from the network, preventing the virus from passing through the organization's network. Based on the diagram Allowed High Risk Applications, you can block for users the most visited potentially dangerous applications that are currently allowed.
The Applications and URL Filtering by Risk, Security Incidents by Severity, and Attack Actions by Policy diagrams are systematic and indicate whether the security situation in your organization improves over time, that is, whether the security policy changes have helped to secure the infrastructure more.
Cyber Attack Overview


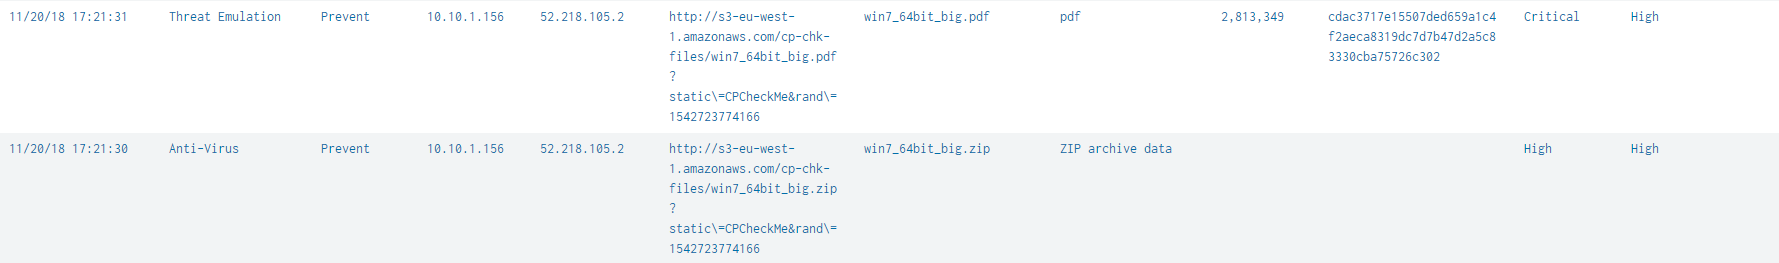
This dashboard shows more detailed information on infected hosts and users who download viruses. It is very convenient to separate the downloaded infected files and the infected emails, you can define threats and create a Threat Prevention security policy for individual services, one security profile for smtp traffic and another profile for http and https. SandBlast Protection provides more detailed information on the infected files, you can look at Severity and identify the flaws in your Threat Prevention security profile.
Conclusion
Thanks to this application, it is very quickly and conveniently possible to obtain information on weak points in your security policy, setting up the application takes a little time and does not require extensive qualifications for these solutions. That is, if you doubt your security settings and you need some analysis without spending a lot of time, then this is a very convenient solution. However, it is clear that the application still needs serious work, there is no statistics on users, it is very interesting to see the list of the most used applications and the amount of traffic that goes there, etc. Since this is only the first version, the application will be updated, and most likely it will be a very good analysis solution over time, but now if we consider this application only as a log analysis, it is much inferior to other solutions.
If you still haven't tried Splunk to analyze Check Point logs, then it's time to start. If you have questions or problems with Splunk or Check Point - you can ask them to us and we will help.
Only registered users can participate in the survey. Sign in , please.