How to increase conversion in ecommers using exit polls
- Transfer

If you are an owner of an e-commerce business and want to increase conversion and profit, then you have come to the address. In this article, you will learn how to increase conversion using the proven optimization process called “Exit intent technology” or if in Russian “Exit Survey”.
How to increase conversion and sales
The easiest way is to break the ecommerce optimization into two steps:
Step 1 : Find out which section your visitors are leaving the site
Step 2 : Find out why your visitors are leaving the site and change this
These two steps are two different types of data that you You can collect and analyze, so that in the future, relying on them, increase the conversion rate of your online store.
Stage 1 is information about numbers or, as it is formally called, information about quantitative data. What exactly people click with the mouse while on the site, which pages they go to and from which they leave your site. An example of a quantitative data source is your Google Analytics account.
Stage 2 is about the behavior of site visitors, the so-called qualitative data. Why do the customers leave the site from the cart page, why they do not understand your product descriptions, and so on. Examples of quality data are user testing, customer interviews, customer surveys, or forced polls when leaving a site.
How exit polling fits into the overall conversion optimization process
Before you learn how to collect high-quality customer data from exit polls and turn this information into money, you must understand the whole process of optimizing the conversion rate.
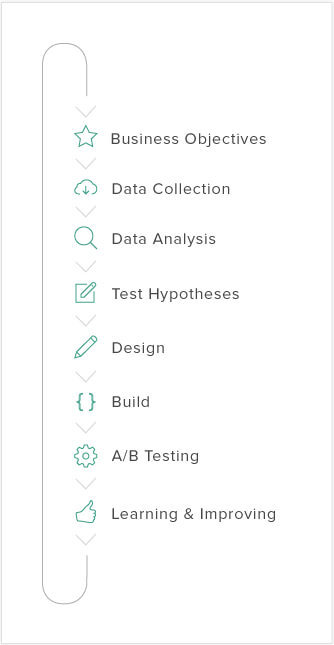
Here is the general picture of this process:
Step 1 : Business goals
The first step is the business goals, simply put, this means that you need to find out how your business looks now and what your goals are for the next three months.
Step 2 : Data collection The
second step is to collect data, as you learned above, it can be quantitative or qualitative data - in your case, you will collect data from the polls to exit.
Step 3 : Data Analysis
The third step is data analysis, understanding what this data means.
Step 4 : Hypothesis Testing
The fourth step offers the idea of matching your site with your data. The "hypothesis" is based on the fact that comparison and testing is a science, but in fact it is statistics.
When checking website changes that you are trying to confirm your statistical hypotheses and make more money.
Step 5 and 6 : Design and Build
The fifth step is to design and code the new website changes that you are going to test.
Step 7 : A / B Testing
The seventh step is to compare and test the new planned changes on the website website with your current website, to make sure that the changes will increase the conversion rate and your profit.
You must ensure that your A / B testing reaches statistical significance, so do not stop this process at an early stage.
Step 8 : Iteration
The final step is to consider what you learned from your testing, whether you proved your hypothesis and, most importantly, what you learned about your customers.
Now let's dive into how to use exit polling information to grow e-commerce.
E-Commerce Conversion Improvement Guide With Outlet Surveys
As you recall, optimizing e-commerce in its simplest form consists of two steps. The first step is to understand from which page the visitors leave your site, now a little more about it.
Step 1: Find where visitors leave the site
The easiest way to find out which pages on your site visitors are leaving is to view a report on the exit pages in Google Analytics.
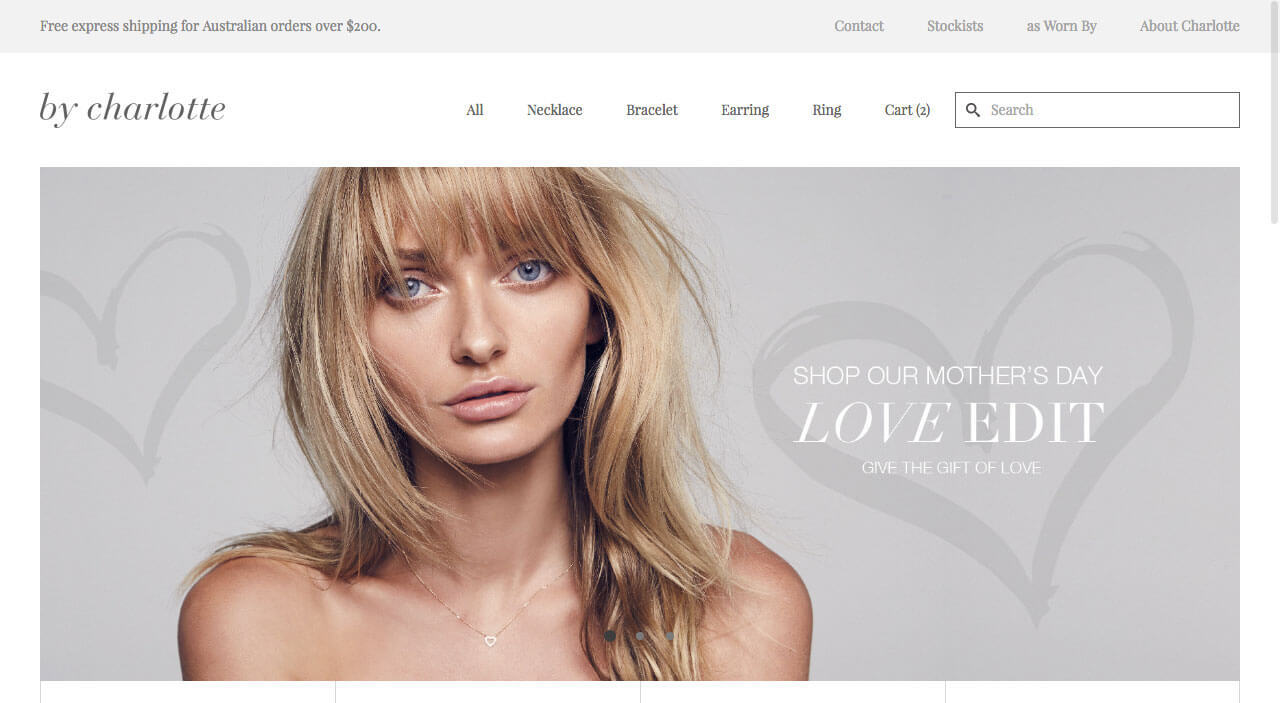
To illustrate this technique, we will look at a case study for ByCharlotte (a jewelry company from Australia).
Log in to your Google Analytics account and go to the tab: Behavior> Site Content> Logout Page.

Then filter the reports and delete pages with low traffic, no traffic and too high traffic. Confirm these changes and follow the filtered settings.
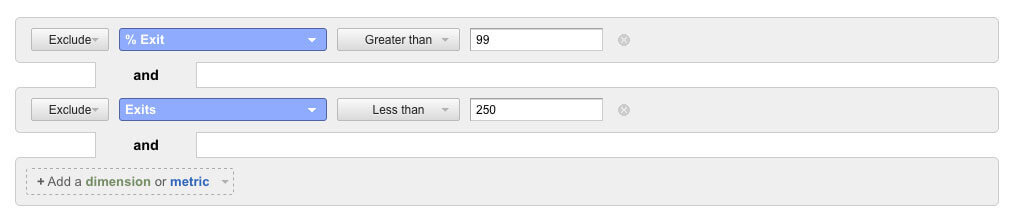
Then order the report with the% exits column. The top pages of this report are the pages that visitors leave.

Step 2: Set Force Polling to Exit
So, now you see from which pages visitors leave the site, now you need to understand for what reason this is happening.
In this particular example, we are using the Hotjar application . (Other applications are Foresee, Usabilla, Qualaroo). We install software, register, enter your personal account and set the tracking code on your online store website.
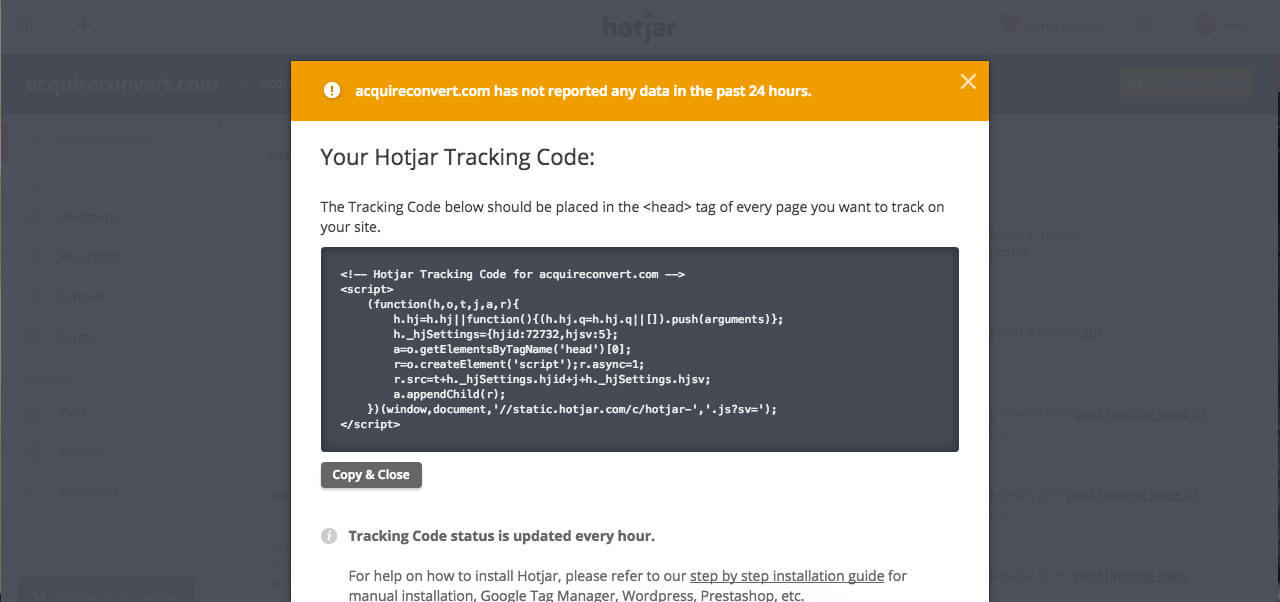
The tracking code should be placed in the tag of each page that you are going to track on your site.
If you use Shopify, it is located in the theme.liquid file.
Then you need to create the survey itself, in our example we interview visitors to find out why they leave the cart page.
Go to the “Polls” menu and click on the “New Poll” button.

Give your survey a name and write a thank you note. In our example, we are going to ask our site visitors: What stops you from today's purchase?

This will help us find out what visitors put into the basket before completing the purchase, as well as why they leave the pages of the basket and leave the site.
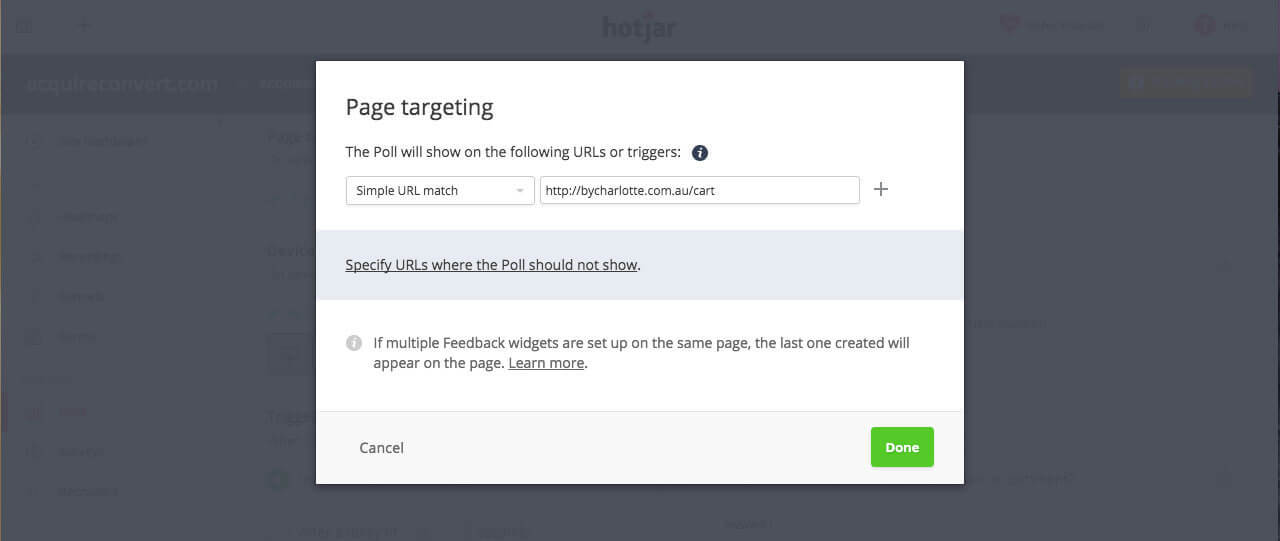
In addition, you need to set a landing page for the survey, in our case, this is the basket page.
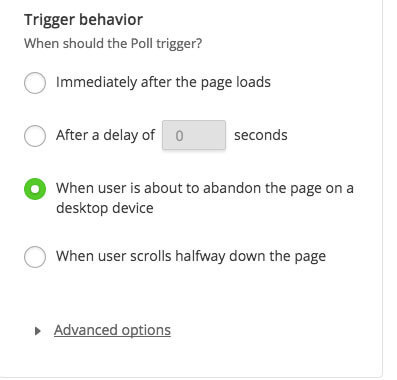
Finally, we come to the essence of exit polling technology. When choosing a behavioral trigger when the survey should be shown, select “When the user is about to leave the page”, also known as forced exit.
What is an exit poll?
This is a survey that is displayed when the user tries to leave the page or moves the cursor towards the cross of the browser window to close the window.
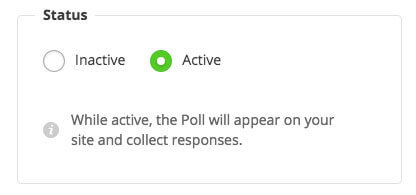
Finally, move the survey to the Active stage and start collecting data.
Step 3: Analyze Your Survey Data
There are three ways to analyze quality data. Keep in mind that when it comes to quality data, analysis takes time. The first way is to depict using a picture, i.e., taking all the answers from the polls at the exit from the site, your client turns all the words related to the problem area, for example, into a cloud of words.

In our example above, exit polls focused on delivery.
The second way is to review all the data and take into account the main thoughts of visitors. What were the people focused on during the survey - on one obvious big flaw or on one right goal? The goal here is to summarize each data point into one or two sentences.
In our study, people left the page due to expected delivery times, also known as delivery times. Delivery time is often considered as the main reason for leaving the site basket. In our case, it was impossible to see or calculate the approximate delivery time, as well as the cost of delivery, in the basket, and these are two very great opportunities for improving and improving the service.
The third way is to quantify your quality data by placing data into categories. This allows you to determine how many people were focused on a major flaw on the page or on the right goal. In our case, 21 out of 32 visitors focused on delivery.
Step 4: A / B testing changes in your online store
At this point, you have already learned where and for what reason visitors are leaving your site. In our example, we found out that the problem page is the trash. Through a Hotjar exit survey, we learned that people confuse the estimated delivery time and shipping cost.
Here is the initial design of the basket page:

And the updated page design:

Based on this data, we added the expected delivery date, delivery cost, as well as a delivery calculator and tested these new products compared to the original options in order to assess the impact of innovations.
It is important to conduct A / B testing to make sure that your new design really improves the quality of customer service and increases profit.
We added new delivery information, but at the same time we updated the design of the store’s theme, so we can’t attribute the increase in conversion by 20% only to the first changes.
Based on all the data we collected, delivery and estimated delivery times were recurring problems in all data sources, so we are sure that these changes played a big role in increasing the conversion by 20%, which we have achieved since the changes were launched.
Run the growth of your online store
As you saw in this article, optimizing e-commerce conversion is a two-step process. Step one is to understand where visitors are leaving your site, step two is why. Now you know everything about collecting and analyzing quality data. And this analysis of quality data contains the key to understanding your customers, their behavior and desires.
Subscribe to our blog, then there will be a lot of interesting things.
By the way, we are engaged in comprehensive maintenance of online stores, maybe someone needs it? :-)
Best regards order fulfillment team-operator " Yamboks "
( Yamboks - transform your online store in a computer game)