Summary of the report “What we know about microservices” (HL2018, Avito, Vadim Madison)
Hi% username%!
Most recently, the Highload ++ conference ended (thanks again to the entire team of organizers and olegbunin personally. It was very cool!).
On the eve of the conference, Alexey fisher proposed to create an initiative group of “stalkers” at the conference. We, during the reports, wrote small notes that we exchanged. Some notes turned out to be quite detailed and detailed.
The community in social networks positively evaluated this format, so I (with permission) decided to publish the outline of the first report. If this format is interesting, then I can prepare a few more articles.

Avito has many services and a lot of links between them. This causes problems:
A large number of infrastructure elements:
There are a number of layers, the report describes only one (PaaS).
The platform has 3 main parts:
CLI push -> CI -> Bake -> Deploy -> Test -> Canary -> Production
Long taught to do the right developers. Still left a weak point.
Automated through cli utility, which helps to create a basis for microservice:
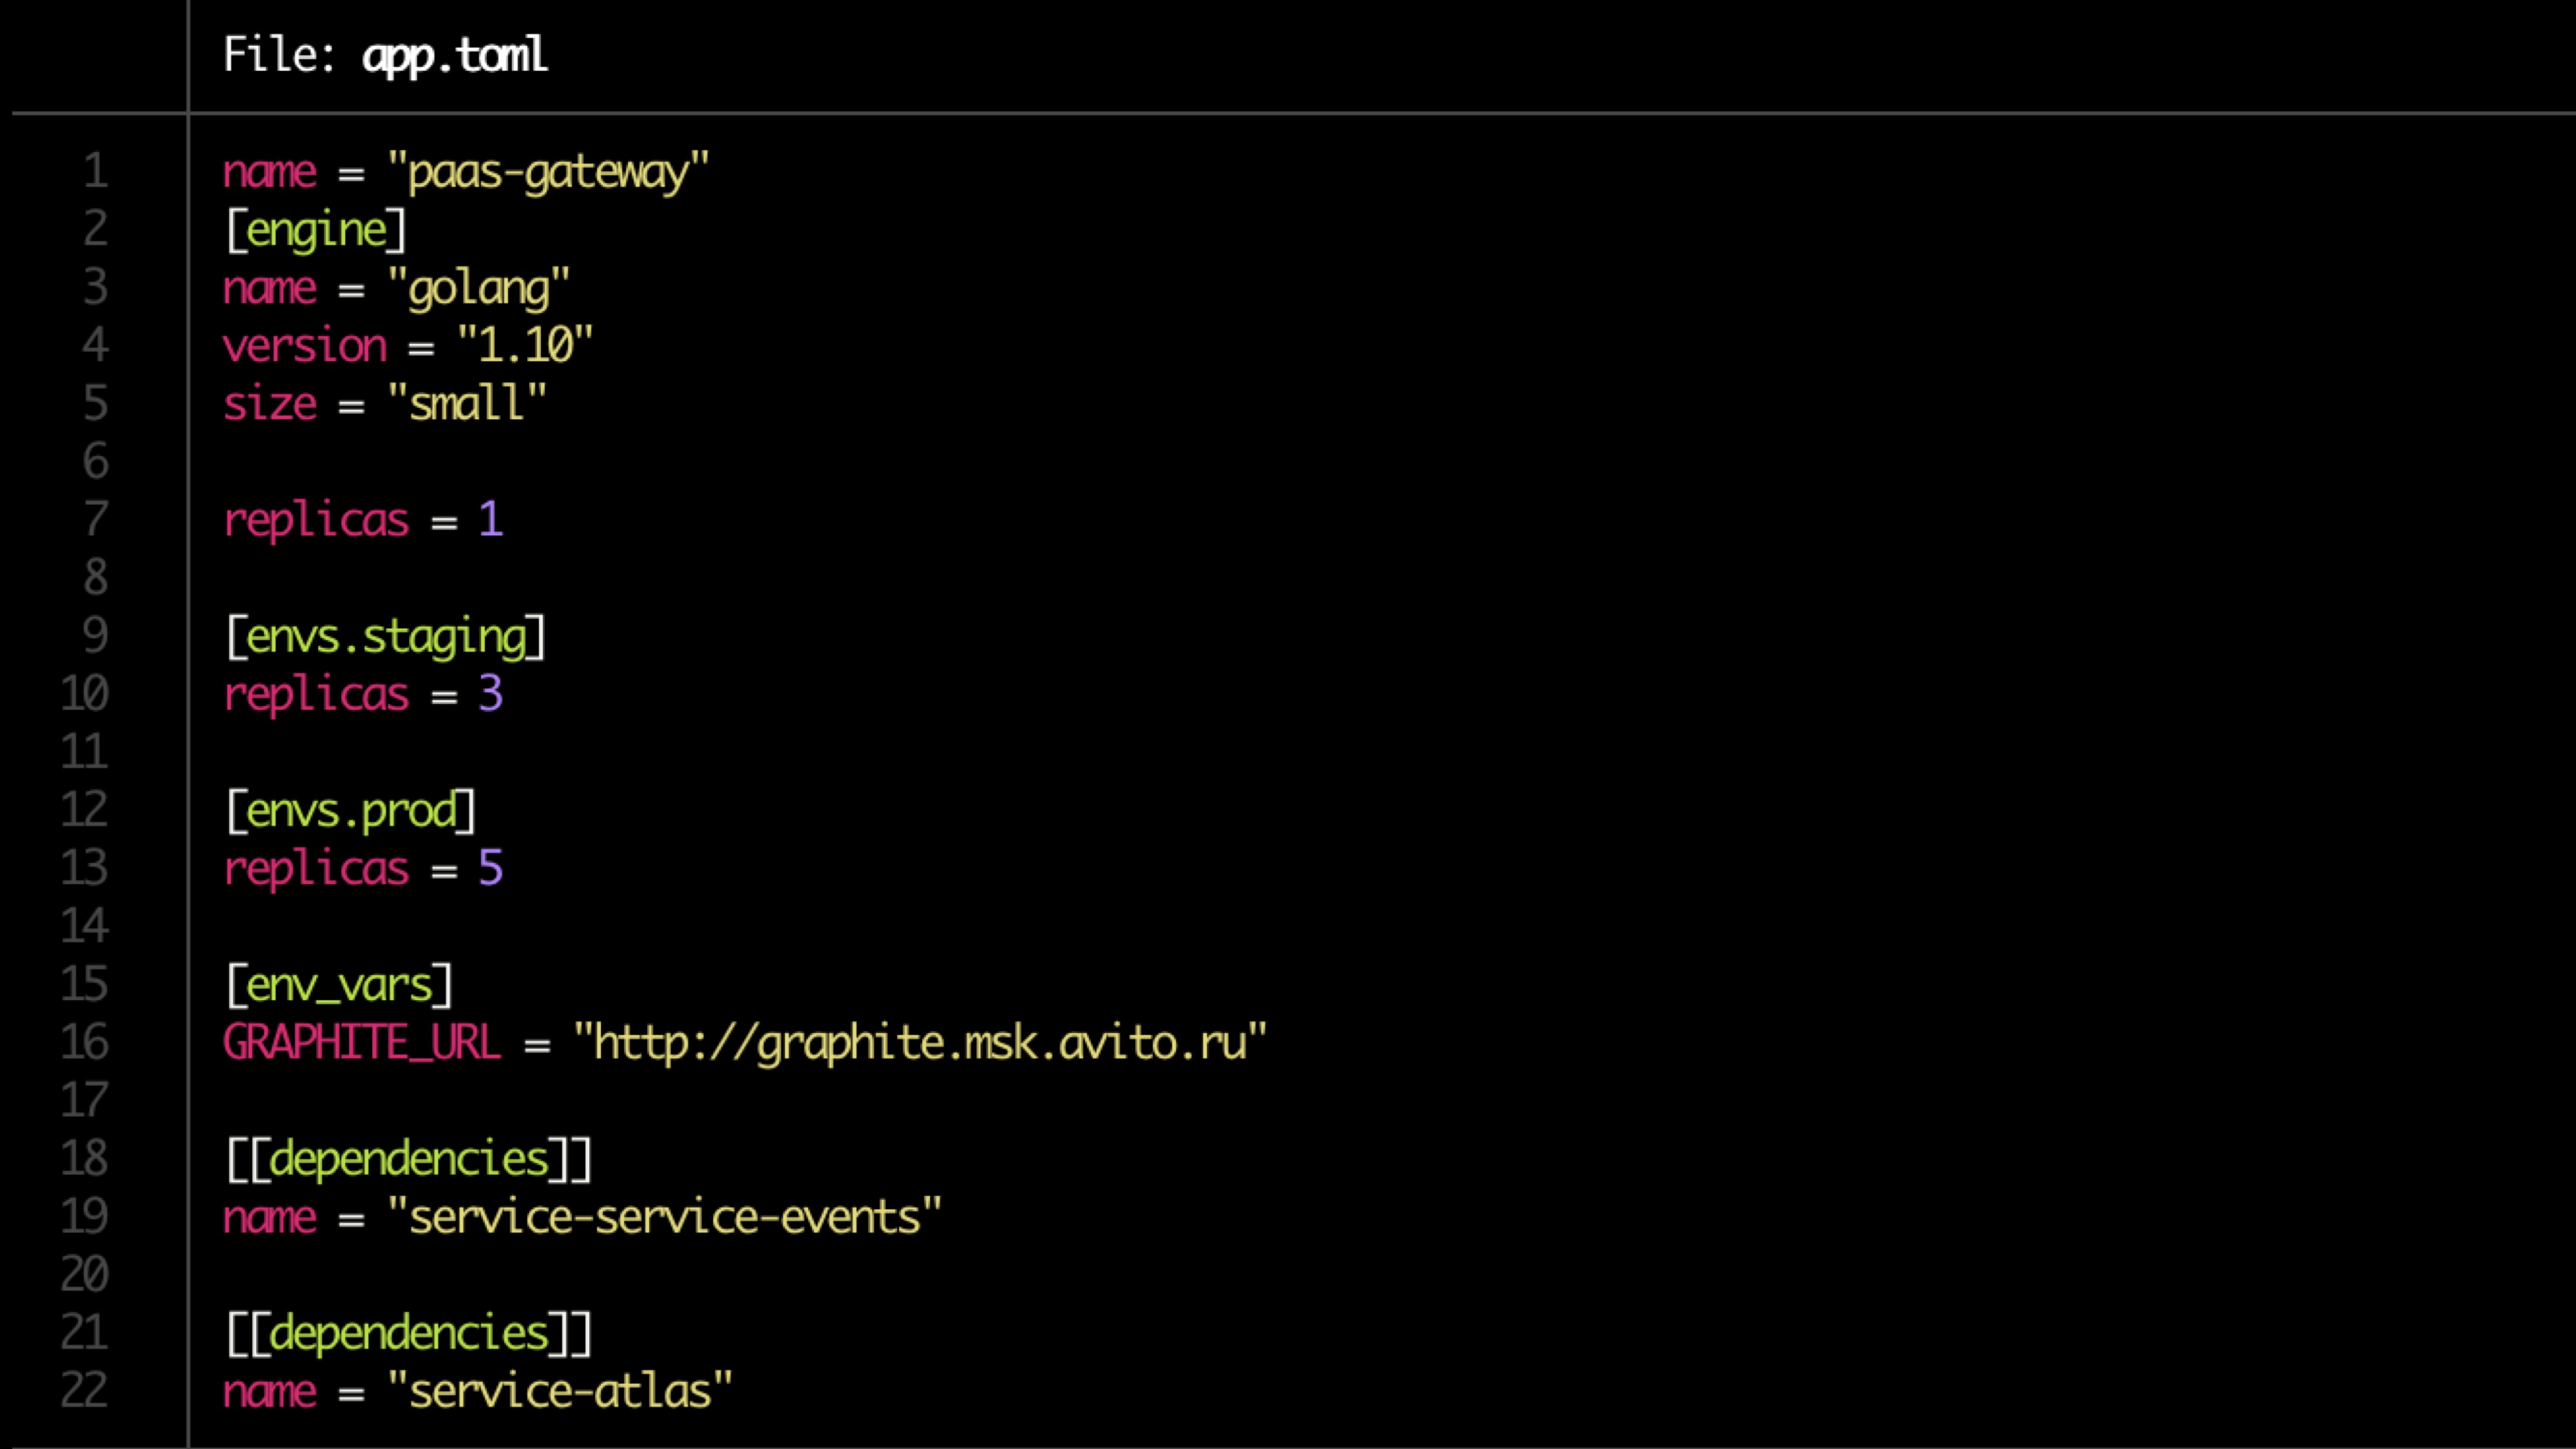
The config is described in the toml file.
Sample file:
Basic validation checks:
Everyone should have the documentation, but almost nobody has it.
The documentation should have:
Documentation needs to be reviewed.
The owner search is determined by the push (the number of push and the amount of code in them).
If there are potentially dangerous migrations (alter), then a trigger is registered in the Atlas and the service is placed in quarantine.
The quarantine is settled to owners through pushy (in manual mode?)
Checking:
Testing is performed in a closed loop (for example, hoverfly.io) - a typical load is recorded. Then it is emulated in a closed loop.
Compliance with resource consumption is checked (separately we look at extreme cases - too few / many resources), cut-off by rps.
Load testing also shows the performance delta between versions.
We start the launch on a very small number of users (<0.1%).
Minimum load 5 minutes. Main 2 hours. Then the volume of users increases if everything is ok.
We look:
Testing through extrusion.
We load with real users 1 instans to a point of failure. We look at his ceiling. Next we add another instance and load it. We look at the next ceiling. We look at the regression. Enrich or replace data from load testing in Atlas.
Only cpu is bad, you need to add food metrics.
The final scheme:
When scaling, do not forget to look for dependencies on services. We remember about the scaling cascade (+1 level). We look at the historical data of the initializing service.
We look at everything from above in an aggregated form and draw conclusions.
Example:

Most recently, the Highload ++ conference ended (thanks again to the entire team of organizers and olegbunin personally. It was very cool!).
On the eve of the conference, Alexey fisher proposed to create an initiative group of “stalkers” at the conference. We, during the reports, wrote small notes that we exchanged. Some notes turned out to be quite detailed and detailed.
The community in social networks positively evaluated this format, so I (with permission) decided to publish the outline of the first report. If this format is interesting, then I can prepare a few more articles.
Drove off
Avito has many services and a lot of links between them. This causes problems:
- Many repositories. Difficult to change code at the same time everywhere
- Teams are limited by their context. Maximum intersect slightly and not all
- Fragmentation of data is added.
A large number of infrastructure elements:
- Logging
- Request Tracing (Jaeger)
- Error Aggregation (Sentry)
- Statuses / messages / events from Kubernetes
- Race limit / Circuit Breaker (Hystrix)
- Service Connectivity (Istio)
- Monitoring (Grafana)
- Build (Teamcity)
- Communication
- Task tracker
- Documentation
- ...
There are a number of layers, the report describes only one (PaaS).
The platform has 3 main parts:
- Generators that are controlled through cli
- Aggregator (collector), which is controlled through dashboards
- Storage with triggers on certain actions.
Standard microservice development pipeline
CLI push -> CI -> Bake -> Deploy -> Test -> Canary -> Production
CLI-push
Long taught to do the right developers. Still left a weak point.
Automated through cli utility, which helps to create a basis for microservice:
- Creates a template service (templates for a number of PL are supported).
- Automatically deploys local development infrastructure
- Connects the database (does not require configuration, the developer does not think about access to any database).
- Live build
- Generation blanks autotests.
The config is described in the toml file.
Sample file:
Validation
Basic validation checks:
- Dockerfile availability
- app.toml
- Availability of documentation
- Dependency
- Rules for monitoring alerts (set by the owner of the service)
Documentation
Everyone should have the documentation, but almost nobody has it.
The documentation should have:
- Service Description (short)
- Link to the architecture diagram
- Runbook
- FAQ
- Endpoint API description
- Labels (binding to product, functionality, structural division)
- The owner (s) of the service (maybe several, in most cases can be determined automatically).
Documentation needs to be reviewed.
Pipeline preparation
- Preparing repositories
- We make pipeline in TeamCity
- We set the rights
- We are looking for the owner (two, one unreliable)
- We register the service in Atlas (internal product)
- Checking the migration.
Bake
- Building an application in docker image.
- Generation of helm-charts for the service itself and related resources (DB, cache)
- Created tickets for administrators to open ports, takes into account the limitations of memory and cpu.
- Run unit tests. Accounting for code coverage is in progress. If below certain, then warm up is wrapped. If the amount of coverage is not progressing, push notifications.
The owner search is determined by the push (the number of push and the amount of code in them).
If there are potentially dangerous migrations (alter), then a trigger is registered in the Atlas and the service is placed in quarantine.
The quarantine is settled to owners through pushy (in manual mode?)
Conventions Check
Checking:
- Service endpoint
- Match the answer scheme
- Log format
- Placing headers (including X-Source-ID when sending messages to the bus to track connectivity through the bus)
Tests
Testing is performed in a closed loop (for example, hoverfly.io) - a typical load is recorded. Then it is emulated in a closed loop.
Compliance with resource consumption is checked (separately we look at extreme cases - too few / many resources), cut-off by rps.
Load testing also shows the performance delta between versions.
Canary tests
We start the launch on a very small number of users (<0.1%).
Minimum load 5 minutes. Main 2 hours. Then the volume of users increases if everything is ok.
We look:
- Product metrics (first of all) - there are a lot of them (100500)
- Sentry errors
- Response statuses
- Respondents time - exact and average response time
- Latency
- Exceptions (processed and unprocessed)
- More specifically for the metric language (for example, php-fpm workers)
Squeeze testing
Testing through extrusion.
We load with real users 1 instans to a point of failure. We look at his ceiling. Next we add another instance and load it. We look at the next ceiling. We look at the regression. Enrich or replace data from load testing in Atlas.
Scaling
Only cpu is bad, you need to add food metrics.
The final scheme:
- CPU + RAM
- Number of requests
- Response time
- Historical data forecast
When scaling, do not forget to look for dependencies on services. We remember about the scaling cascade (+1 level). We look at the historical data of the initializing service.
Additionally
- Trigger handling - migrations if there is no version below X
- Service has not been updated for a long time
- Quarantine
- Secure updates
Dashboard
We look at everything from above in an aggregated form and draw conclusions.
- Filtering by service and label
- Integration with tracing, logging, monitoring
- Single point of service documentation
- Single point of displaying all events by services
Example: