Algorithms and Conversion: How We Looked For the Best Moment to Call Back
A callback widget can be very useful if it appears at the right time. But how to calculate when a site visitor “matures” before talking on the phone?
From the very start of the project, it was obvious that it was necessary to constantly work on improving the efficiency of our widget - this is the only way to get around competitors (which, as you know, are already quite a lot).
Conversion is greatly influenced by choosing the right moment. If the widget “pops up” at the moment when the user has some kind of question, then he will most likely agree to the call and will not experience negative emotions. This moment is the real Holy Grail of all callback widgets, but finding it is not so simple.

Our path has already taken 4 stages, and we hope that it has successfully completed.
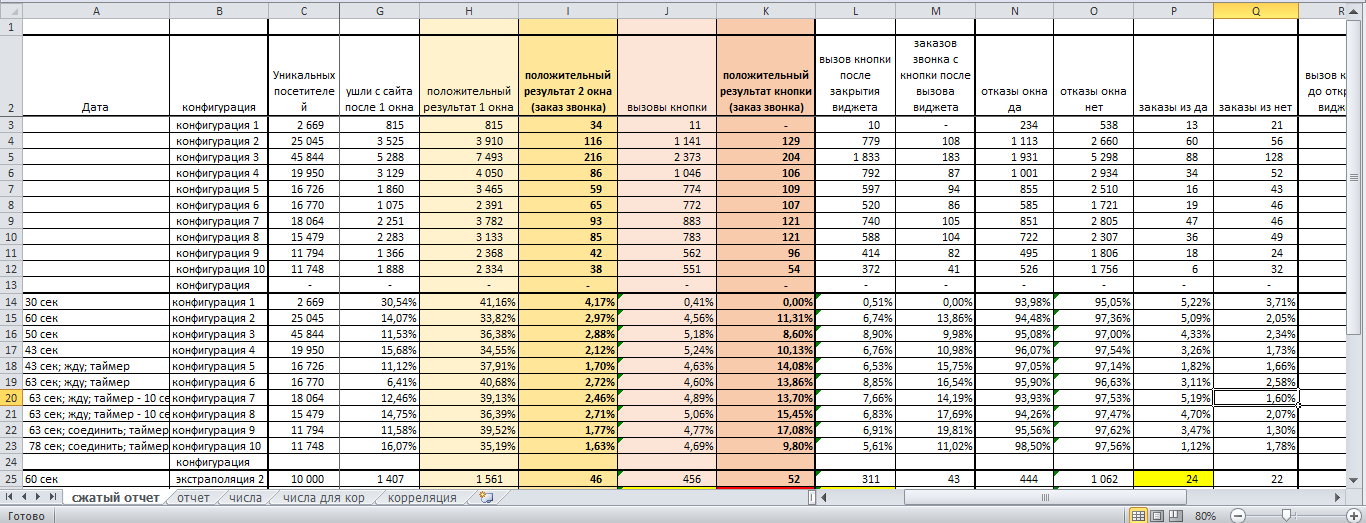
At the time of the start of testing, the number of unique visitors to the sites on which the Cashmyvisit widget stood was about 20 thousand per month.
We decided to check how the delay time until the widget appears on the site affects the conversion - 30, 40, 50 seconds. All connected sites were included in the initial sample; the number of calls per 100 visitors was estimated.
It turned out that too early appearance of the widget leads to an increase in the number of failures. In addition, we noticed that the results are very strongly influenced by various external factors that cannot be influenced in any way - as a result, the numbers, from week to week, varied greatly. All wrong.

When the first stage was in full swing, our project team got to the IIDF conference in St. Petersburg. There we listened to a speech by Grigory Bakunov, Yandex Technology Distribution Director, who very much mentioned A / B testing. Later, we found a video on YouTube about how he, with the help of machine learning and such tests, was engaged in promoting a CRM system in the USA - the mechanism seemed suitable for our tasks.
We began to introduce A / B testing into the development process. In a short time, five scenarios for the appearance of the widget were launched, starting with a timeout of 37 seconds in increments of 8 seconds.
Unfortunately, the hopes did not materialize. After a month of testing, it became clear that:
Do all users need to show the widget? At the next stage, we decided to identify the most involved visitors to the site, and offer a call back only to them. To do this, it was necessary to develop criteria for “interest”. We attributed to them:
In addition, additional “engagement points” were awarded in two cases:
The combination of such behavioral factors was supposed to signal that the appearance of the widget would be timely for the visitor.
Just the day after the introduction of the described mathematical model into the prototype of the new version of the widget, one of the competitors “rolled out” an update that includes everything that we planned to become market leaders with!
It was a blow to our pride, but we brought what we started to the end and released our own update. The collected data showed that the product still does not work as we would like.
Then we brought in professional mathematicians who pointed out the main mistake. At us and at competitors, the time spent by the user on the site was the most important indicator in the entire system. In 9 different parameters, the degree of correlation with the “time” parameter was more than 80% - as a result, the system did not control how many people would display the widget and did not correlate its behavior with the theme of a particular site.
It became clear - this system is far from the Grail.
It is the method of support vectors - we were recommended to use mathematicians.

We decided to try and after a couple of hours the development department, together with mathematicians, wrote down formulas of paper.
The resulting system includes several parameters in 230 sections (site pages, sources of visits, time on the site, time of day, day of the week, etc.). During the analysis, natural logarithms are calculated, the values are summed, this amount is compared with unity. If the result is equal to or greater than one, then the widget is displayed to the visitor. Values are recalculated every second.
It took several months to finalize the system, in April we launched it in test mode on a small selection of client sites. Already the first measurements showed an increase in conversion, on average, by 20-25%.
For all the searches, trials and errors described above, it took us more than six months. However, the result obtained as a result pleases both us and our customers (here we talked about how using the widget helped to increase the loyalty of car dealers' customers). We are not going to stop there and continue to refine the system so that the conversion is even higher.
After all, continuous development is the only way to win in a competitive market like ours.

Our path has already taken 4 stages, and we hope that it has successfully completed.
Stage one: different times of the appearance of the widget
At the time of the start of testing, the number of unique visitors to the sites on which the Cashmyvisit widget stood was about 20 thousand per month.
We decided to check how the delay time until the widget appears on the site affects the conversion - 30, 40, 50 seconds. All connected sites were included in the initial sample; the number of calls per 100 visitors was estimated.
It turned out that too early appearance of the widget leads to an increase in the number of failures. In addition, we noticed that the results are very strongly influenced by various external factors that cannot be influenced in any way - as a result, the numbers, from week to week, varied greatly. All wrong.
Stage Two: A / B Tests
When the first stage was in full swing, our project team got to the IIDF conference in St. Petersburg. There we listened to a speech by Grigory Bakunov, Yandex Technology Distribution Director, who very much mentioned A / B testing. Later, we found a video on YouTube about how he, with the help of machine learning and such tests, was engaged in promoting a CRM system in the USA - the mechanism seemed suitable for our tasks.
We began to introduce A / B testing into the development process. In a short time, five scenarios for the appearance of the widget were launched, starting with a timeout of 37 seconds in increments of 8 seconds.
Unfortunately, the hopes did not materialize. After a month of testing, it became clear that:
- He does not provide food for real conclusions.
- Data throughout the system is generally irrelevant for one particular site.
- Conclusions should be made not upon the visit to the site, but upon the activation of the widget.
Stage Three: Criteria for Determining Interest
Do all users need to show the widget? At the next stage, we decided to identify the most involved visitors to the site, and offer a call back only to them. To do this, it was necessary to develop criteria for “interest”. We attributed to them:
- The activity time on the site is more than 30 seconds (based on tracking mouse movements).
- The user’s activity time is longer than the average activity time of other visitors.
- Depth of view exceeds average figures.
- The source of the transition was a contextual advertisement.
In addition, additional “engagement points” were awarded in two cases:
- For every 15 seconds, in excess of the average time spent on the site.
- For the implementation of 100% page scroll.
The combination of such behavioral factors was supposed to signal that the appearance of the widget would be timely for the visitor.
Just the day after the introduction of the described mathematical model into the prototype of the new version of the widget, one of the competitors “rolled out” an update that includes everything that we planned to become market leaders with!
It was a blow to our pride, but we brought what we started to the end and released our own update. The collected data showed that the product still does not work as we would like.
Then we brought in professional mathematicians who pointed out the main mistake. At us and at competitors, the time spent by the user on the site was the most important indicator in the entire system. In 9 different parameters, the degree of correlation with the “time” parameter was more than 80% - as a result, the system did not control how many people would display the widget and did not correlate its behavior with the theme of a particular site.
It became clear - this system is far from the Grail.
The fourth stage: reference vectors
It is the method of support vectors - we were recommended to use mathematicians.
We decided to try and after a couple of hours the development department, together with mathematicians, wrote down formulas of paper.
The resulting system includes several parameters in 230 sections (site pages, sources of visits, time on the site, time of day, day of the week, etc.). During the analysis, natural logarithms are calculated, the values are summed, this amount is compared with unity. If the result is equal to or greater than one, then the widget is displayed to the visitor. Values are recalculated every second.
It took several months to finalize the system, in April we launched it in test mode on a small selection of client sites. Already the first measurements showed an increase in conversion, on average, by 20-25%.
Rejoice early
For all the searches, trials and errors described above, it took us more than six months. However, the result obtained as a result pleases both us and our customers (here we talked about how using the widget helped to increase the loyalty of car dealers' customers). We are not going to stop there and continue to refine the system so that the conversion is even higher.
After all, continuous development is the only way to win in a competitive market like ours.