Give us an application that turns budgets into interactive infographics
 What I like in the West, and in particular among the Americans, is their ability to count money. We often neglect this, and sometimes it seems that this is our main problem.
 In 2015, people seem to have forgotten what democracy means. The government exists to serve people, and the money collected in the form of taxes is supposed to be spent on what people want and need.
The new cloud-based application provides
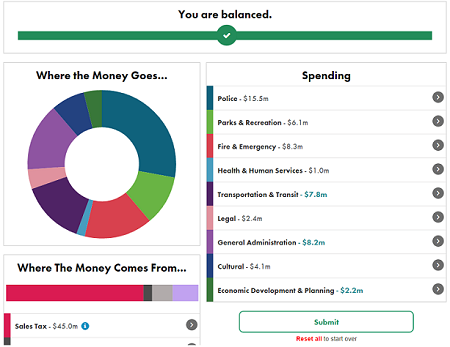
This app is called A Balancing Act.and developed by Engaged Public and Causelabs. It is an interactive infographic platform that allows users to see how the budget is distributed. Users can see various costs, their reduction or increase, tax changes, etc. General modeling allows any user playing with the tool to see how the budget is balanced.
The tool is currently in use in at least two municipalities: Colorado and Hartford (Connecticut).
The state of Colorado spends its budget through an application that allows citizens to easily see where their taxes are spent. Education and healthcare are Colorado's largest cost points, with a combined price of $ 6.9 billion.
Other municipalities also provide tax information on their open information portals, but not everyone can figure out unstructured data. And this tool will clearly show how exactly the citizen’s money is spent. For example, a 40-year-old citizen earning $ 65,000 a year can see that $ 783.61 is spent on public school funds from his taxes, 94 cents on maintaining libraries and $ 147.99 spent on keeping
Information is searched on the service by the postal code, and as you know, it is available only in the states. But it would be interesting to see the distribution of our taxes with you.
Only registered users can participate in the survey. Please come in.
What do you think, such a service would not be amiss?
- 89.5% Yes, I want to know where they spend money 77
- 2.3% No, I don't care 2
- 2.3% Other (I will explain in the comments) 2
- 5.8% Just show me the result 5