Developing fast mobile applications on Android. Part one
- Transfer
- Tutorial
In Edison, we often encounter optimization of mobile applications and want to share material that we consider extremely useful if you solve one of two problems: a) want the application to slow down less; b) want to make a beautiful, soft and smooth interface for the mass user.
We bring to your attention the first part of the translation of the article by Udi Cohen, which we used as a guide for training young colleagues optimizing for Android.
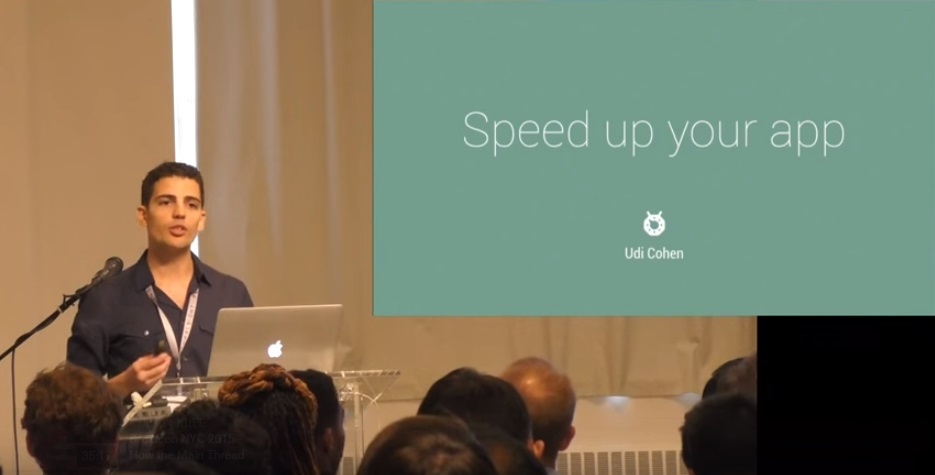
A few weeks ago, I spoke at Droidcon in New York with a report on Android performance optimization.
I spent a lot of time on the presentation, because I wanted to show real examples of performance problems, and how they can be identified using the available tools. I had to remove half of the slides because I did not have enough time to show everything. In this article, I collected everything that I talked about, as well as examples that I did not have time to show.
My basic rules that I follow when working with optimization.
Every time I encounter performance problems or look for a solution to these problems, I follow the following rules.
Always measure - optimizing by eye is always a bad idea. After you watch the same animations several times, it will start to seem to you that they are going faster. Numbers don't lie. Use the tools we’ll move on to soon and measure several times how your application works before and after the changes.
Use slow devices - if you really want to find all the weak points, slow devices will help you more with this. With newer and more powerful devices, you don’t have to worry so much about performance issues, but not all users use the latest and best models.
Compromises- performance optimization is built on compromises. You are optimizing one, but at the cost of something else. In many cases, this other thing can be your time spent searching and fixing, or the quality of your bitmap images, or the amount of data that you need to store in certain structures. Be prepared for such sacrifices.
Systrace is one of the greatest tools you probably don't use. This is because the developers were not sure what to do with the information received.
Systrace provides an overview of the applications that currently run on the phone. This tool reminds us that the phone we hold in our hands is a powerful computer that can perform many operations at one time. In one of the latest updates to the SDK Tools, this tool was supplemented with data-driven assumptions that help us find the problem. Let's see what the trace result looks like:
(images are clickable) You can get the trace result using the Android Device Monitor or using the command line. You can find more information here.
.
In the video I talked about the components of the report. Of particular interest are Alerts and Frames, which provide us with assumptions generated from the data collected. Let's take a look at the trace I took and select one of the warnings at the top. Alert states that there was a lengthy call to View # draw (). We also get a description, links to documentation, and even links to videos with discussions on this topic. Looking at the Frames line below, we see the labels corresponding to each rendered frame; they are painted in green, yellow or red to reflect performance problems that arise during the rendering of the frame. Let's choose one of the frames marked in red.
Below we will see all the relevant notifications for this frame. In this case, we have 3 messages, one of them we have already seen. Let's enlarge this frame and open the “Inflation during ListView recycling” notification: We see that the total for this part took 32ms, which is why rendering the frame takes longer than 16ms required to reach 60fps. Here is more detailed information on each component in the ListView for this frame - about 5ms were spent on 5 of them. Their description will help us understand the problem and even find a solution. The diagram above shows all the calls, we can enlarge or stretch it to see which parts of the drawing require more time. Another example of slow frame rendering:

After selecting a frame, we can press the m key to select it and see how much time this part takes. Looking above, we see that it takes 19ms to render the frame. Having opened the notification for this frame, we see the message “Scheduling delay”.
This means that the thread processing this particular frame has not been scheduled on the processor for a long time. Thus, it took more time to finish his work. After selecting the longest part, more detailed information is opened. Wall duration - this is the time spent from the beginning until the end of the element. It is called “Wall duration” because it is like tracking a wall clock from the moment the thread started. CPU duration
Is the actual time that the processor spent on this part.
The big difference between these two dimensions is noticeable. While the overall work takes 18ms, the CPU spends only 4ms on a thread. This is a bit strange, so it would be nice to see what the processor does the remaining time: All 4 cores are very busy. Selecting one of the streams shows us where it appeared, an application called com.udinic.keepbusyapp. In this case, another application was the reason that the processor was loaded without paying attention to your application for some time.

While this scenario is usually temporary, as other applications usually do not steal the processor in the background (... right?), But such threads may come from different processes in your application or even from the main process. Thus, Systrace is a review tool, but there is a limit to how deep it can look. To find what takes our processor time, we will use another tool called Traceview.
Traceview is a profiling tool that shows how long each running method lasts. Let's see what the trace result looks like: This tool can be launched from Android Device Monitor or from code. More information is here . Let's look at the following columns.
I opened an application that had problems with scroll smoothness. I started tracing, leafed through a bit and settled on one line. I came across the getView () method and opened it, and here is what I saw: This method was called 12 times, the processor spent about 3 ms for each call, but the real time it takes for each call is 162 ms! Definitely a problem ... Looking at the calls from this method, we can see how the total time is divided between different methods. Thread.join () takes about 98% of real time. This method is used when we want to wait for the end of another process. One of the other descendants is Thread.start (), which allows me to assume that getView () opens the stream and waits for it to finish. But where is this stream?
We cannot see what this thread does, since getView () itself does not do this work. To find it, I looked for the Thread.run () method, which is called when a new thread appears. I followed him until I found the culprit: I found that BgService.doWork () requires about 14 ms per call, and we have about 40 such calls! There is also a chance that each getView () will call it more than once, and this explains why each getView () call takes so long. This method takes a processor for a long time. Looking at Exclusive CPU time, we see that it uses 80% of the processor time!

Sorting by Exclusive CPU time is also a good way to find the busiest methods that can contribute to the performance problems you are experiencing.
Tracking such critical methods as getView (), View # onDraw () and others will help us find the reason why our application is slow to execute. But sometimes there is something that loads our processor, taking away precious processor cycles that can be spent on smoother rendering of our UI. The garbage collector works occasionally, removing unused objects, and usually does not have much effect on the foreground application. If the garbage collector works too often, this can slow down our application, and it is entirely possible that we ourselves are to blame for this ...
Android Studio has been improved recently, with more and more tools added to help us find and analyze performance issues. The Memory tab in the Android window will show us the change in the amount of data on the heap over time. Here's what it looks like: Where we see small drops in the graph, the garbage collector collects and deletes unused objects and frees memory on the heap. There are 2 tools available on the left side of the graph: Heap dump and Allocation Tracker.

To examine what is currently in our heap, we can use the left button Heap dump. This tool will take a snapshot of what is currently on the heap and show it in a special report screen inside Android Studio:
On the left, we can see a histogram of instances of objects on the heap, grouped by class name. For each of them, the total number of objects for which memory is allocated, the size of these objects (Schallow size) and the size of objects stored in memory are indicated. The latter tells us how much memory can be freed if instances of objects are destroyed. This gives us an important insight into the memory footprint of our application, helping to identify large data structures and relationships between objects. This information can help us build more efficient data structures, remove relationships between objects, to reduce memory consumption and ultimately reduce memory as much as possible.
Looking at the histogram, we see that MemoryActivity has 39 instances of objects, which seems strange for activity. Selecting one of its instances on the right, we will open the list of all links of this object in the base tree below. One of them is part of the array inside the ListenersManager object. Looking at other instances of activity, it turns out that they are all stored in this object. This explains why an object of this class uses so much memory.


Such situations are known to be called a “memory leak”, since the activity was clearly destroyed, but unused memory cannot be cleared by the garbage collector due to this link. We can avoid such situations if we are sure that our objects do not refer to other objects that survived it. In this case, ListenersManager does not need to save this link after the activity has been destroyed. The solution is to remove the link before the class instance is destroyed in the onDestory () method.
Memory leaks of other large objects take up a lot of space on the heap, reducing the amount of available memory and causing frequent calls to the garbage collector in an attempt to free up more space. These calls will occupy the processor, causing a drop in the performance of your application. If the amount of available memory is not enough for the application, and the heap size cannot be slightly increased, a more dramatic outcome will occur - OutOfMemoryException, which will lead to the application crashing.
A more advanced tool is the Eclipse Memory Analyzer Tool (Eclipse MAT): This tool can do the same as Android Studio, in addition it can detect possible memory leaks and provide a more advanced search for objects, such as searching for all Bitmaps larger than 2 MB, or all
empty rect objects .
Another great tool is the LeakCanary library , which monitors all your objects and makes sure that there is no memory leak due to them. If this still happened, you will receive a notification to know where and what happened.

Allocation Tracker can be opened / closed using the button to the left of the memory graph. He will compile a report on all instances of the class allocated in memory for this period of time, grouped by classes: or by methods: There is also a good visualization showing us the largest instances. Using this information, we can find methods that take up too much memory and can generate many garbage collector calls. We can also find many examples of objects of the same class with a short life cycle in which we can use the Object Pool to reduce memory allocation. Continued in the second part . PS The report was recorded on video and you can watch it here:
Slides are also available .
We bring to your attention the first part of the translation of the article by Udi Cohen, which we used as a guide for training young colleagues optimizing for Android.
A few weeks ago, I spoke at Droidcon in New York with a report on Android performance optimization.
I spent a lot of time on the presentation, because I wanted to show real examples of performance problems, and how they can be identified using the available tools. I had to remove half of the slides because I did not have enough time to show everything. In this article, I collected everything that I talked about, as well as examples that I did not have time to show.
My basic rules that I follow when working with optimization.
My rules
Every time I encounter performance problems or look for a solution to these problems, I follow the following rules.
Always measure - optimizing by eye is always a bad idea. After you watch the same animations several times, it will start to seem to you that they are going faster. Numbers don't lie. Use the tools we’ll move on to soon and measure several times how your application works before and after the changes.
Use slow devices - if you really want to find all the weak points, slow devices will help you more with this. With newer and more powerful devices, you don’t have to worry so much about performance issues, but not all users use the latest and best models.
Compromises- performance optimization is built on compromises. You are optimizing one, but at the cost of something else. In many cases, this other thing can be your time spent searching and fixing, or the quality of your bitmap images, or the amount of data that you need to store in certain structures. Be prepared for such sacrifices.
Systrace
Systrace is one of the greatest tools you probably don't use. This is because the developers were not sure what to do with the information received.
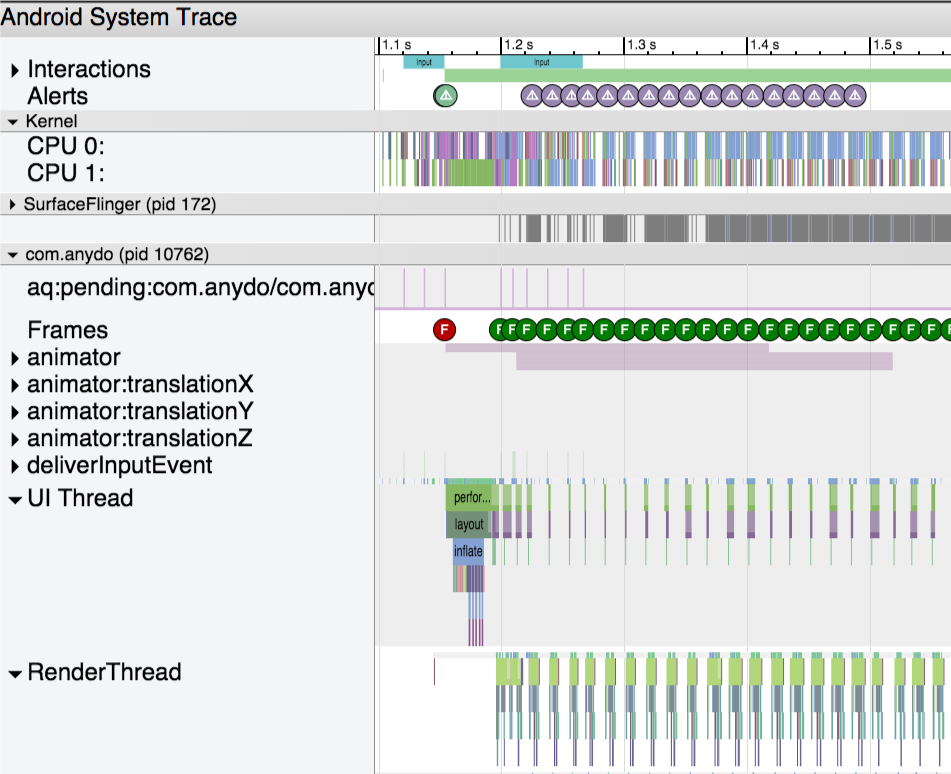
Systrace provides an overview of the applications that currently run on the phone. This tool reminds us that the phone we hold in our hands is a powerful computer that can perform many operations at one time. In one of the latest updates to the SDK Tools, this tool was supplemented with data-driven assumptions that help us find the problem. Let's see what the trace result looks like:
(images are clickable) You can get the trace result using the Android Device Monitor or using the command line. You can find more information here.
.
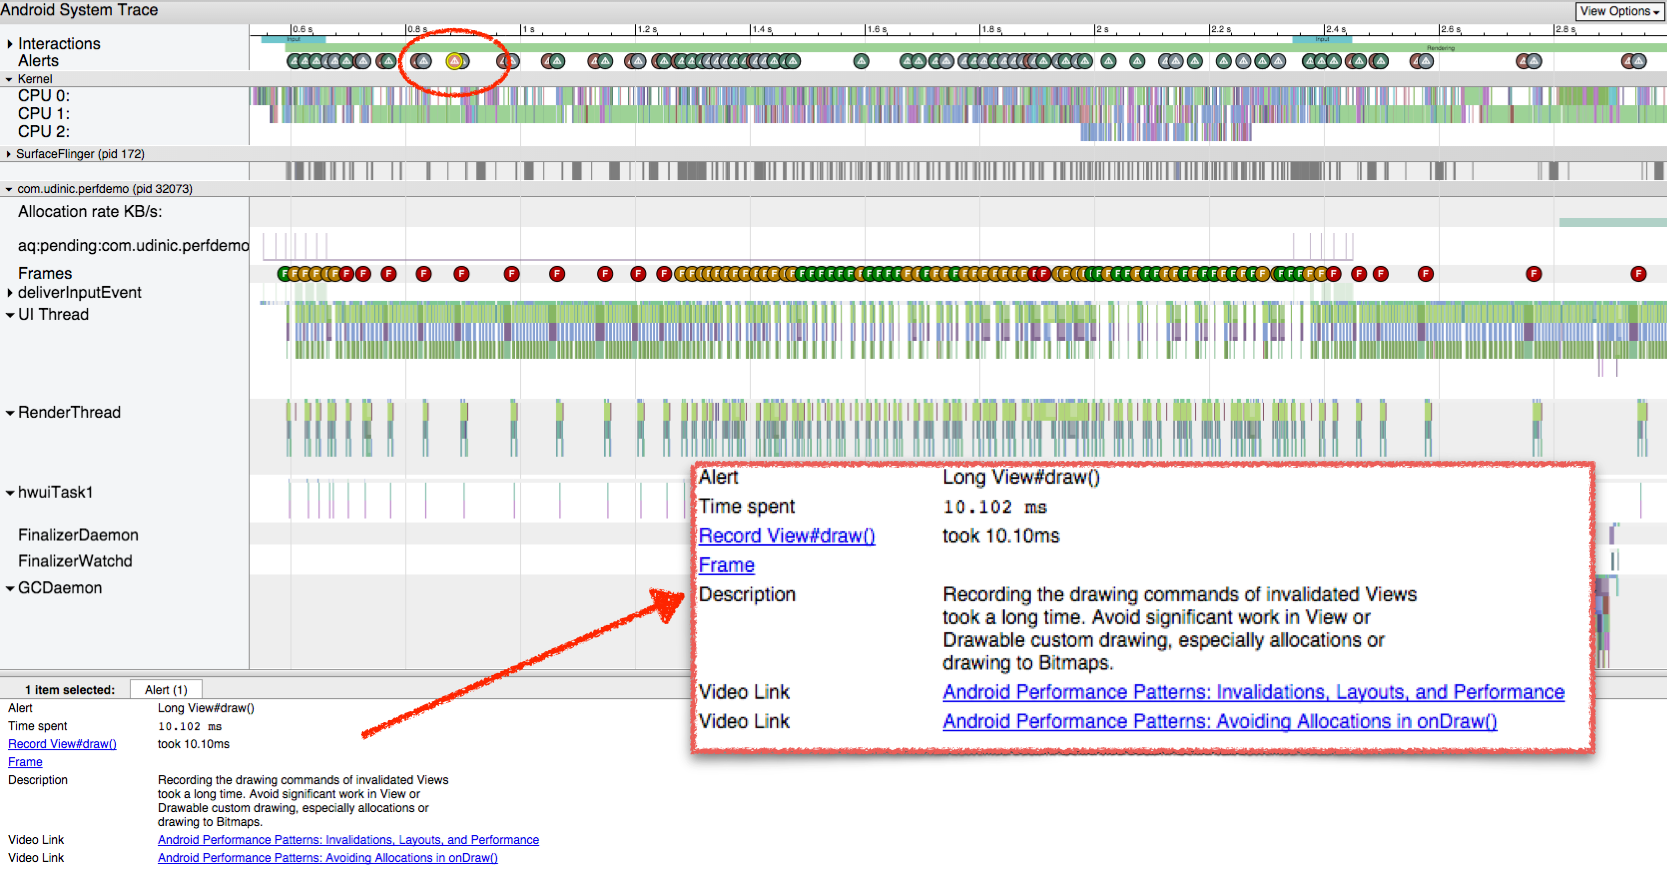
In the video I talked about the components of the report. Of particular interest are Alerts and Frames, which provide us with assumptions generated from the data collected. Let's take a look at the trace I took and select one of the warnings at the top. Alert states that there was a lengthy call to View # draw (). We also get a description, links to documentation, and even links to videos with discussions on this topic. Looking at the Frames line below, we see the labels corresponding to each rendered frame; they are painted in green, yellow or red to reflect performance problems that arise during the rendering of the frame. Let's choose one of the frames marked in red.
Below we will see all the relevant notifications for this frame. In this case, we have 3 messages, one of them we have already seen. Let's enlarge this frame and open the “Inflation during ListView recycling” notification: We see that the total for this part took 32ms, which is why rendering the frame takes longer than 16ms required to reach 60fps. Here is more detailed information on each component in the ListView for this frame - about 5ms were spent on 5 of them. Their description will help us understand the problem and even find a solution. The diagram above shows all the calls, we can enlarge or stretch it to see which parts of the drawing require more time. Another example of slow frame rendering:


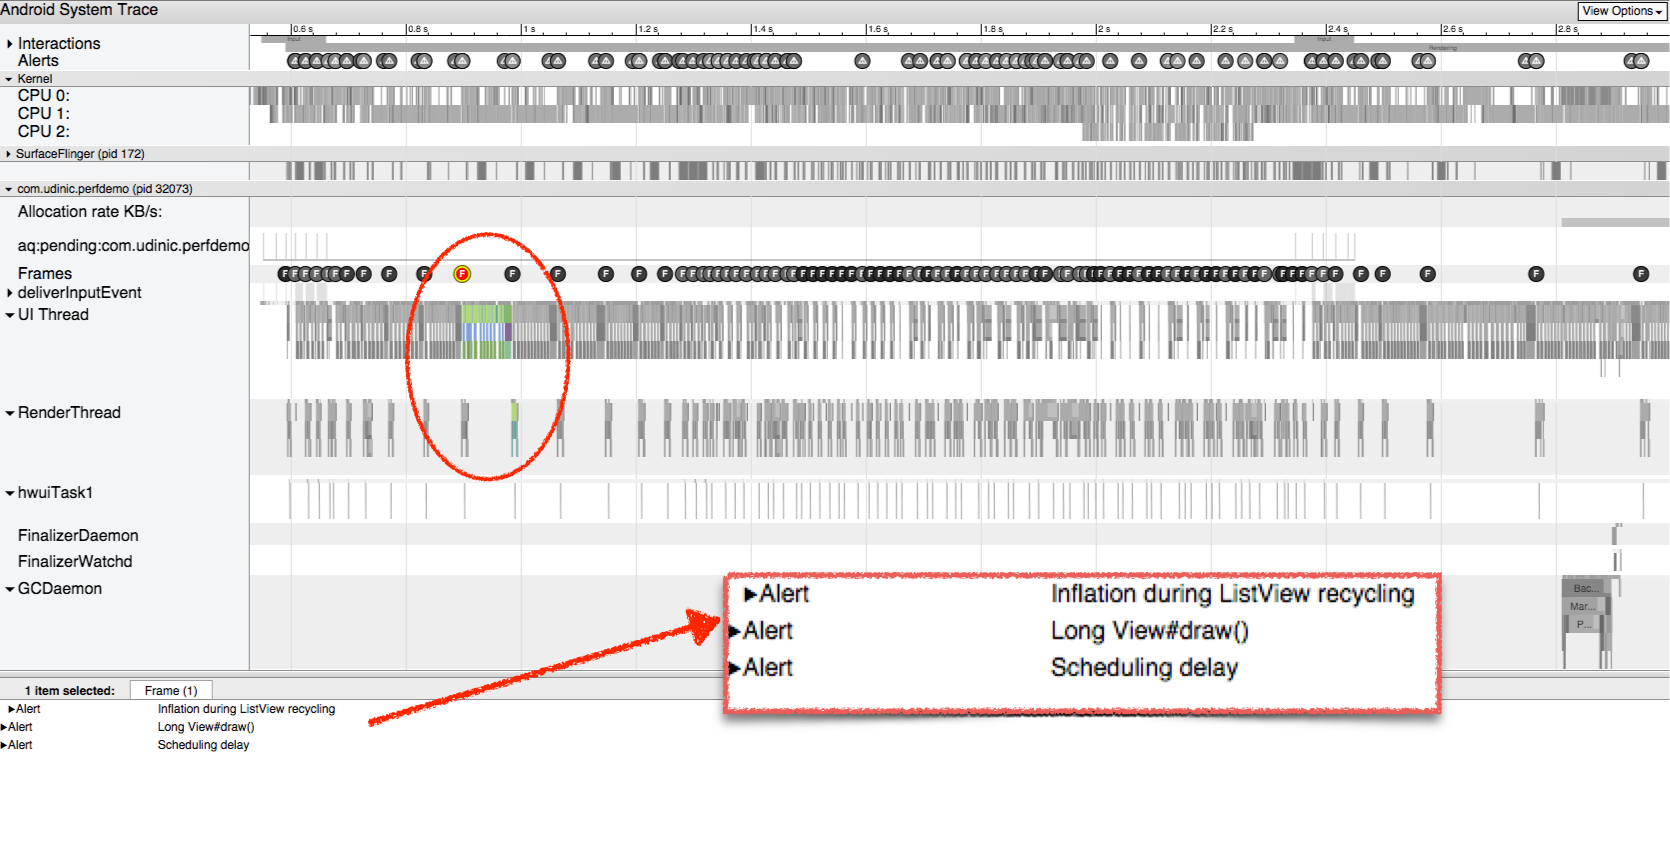
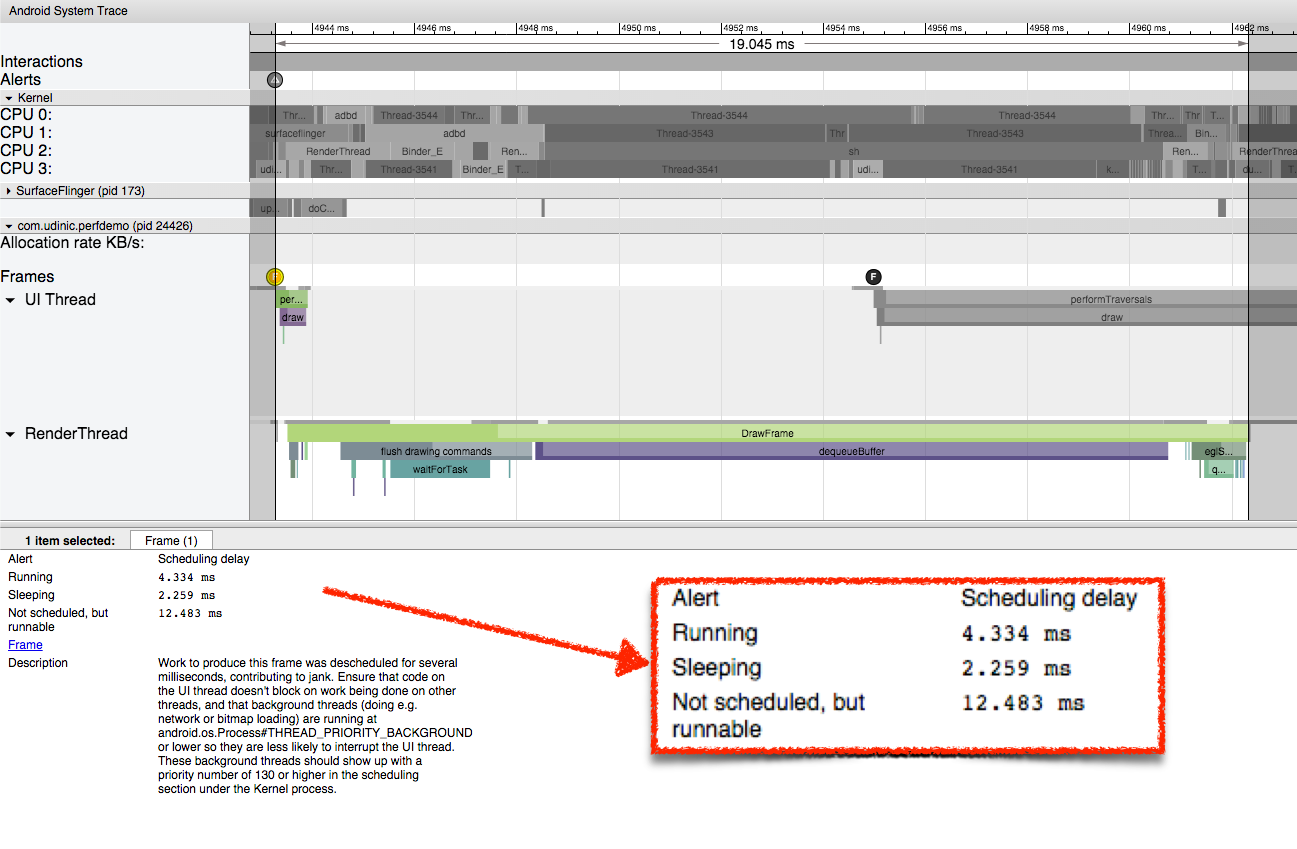
After selecting a frame, we can press the m key to select it and see how much time this part takes. Looking above, we see that it takes 19ms to render the frame. Having opened the notification for this frame, we see the message “Scheduling delay”.
This means that the thread processing this particular frame has not been scheduled on the processor for a long time. Thus, it took more time to finish his work. After selecting the longest part, more detailed information is opened. Wall duration - this is the time spent from the beginning until the end of the element. It is called “Wall duration” because it is like tracking a wall clock from the moment the thread started. CPU duration

Is the actual time that the processor spent on this part.
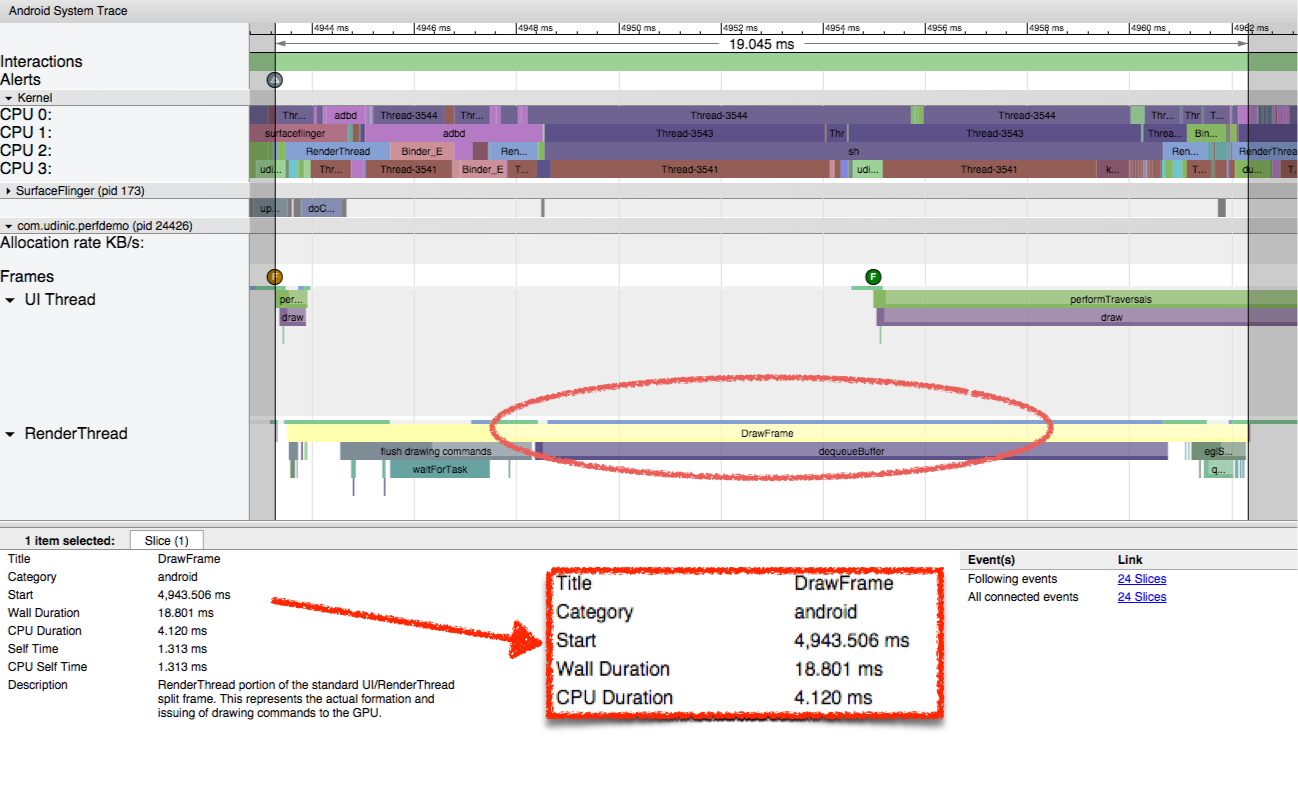
The big difference between these two dimensions is noticeable. While the overall work takes 18ms, the CPU spends only 4ms on a thread. This is a bit strange, so it would be nice to see what the processor does the remaining time: All 4 cores are very busy. Selecting one of the streams shows us where it appeared, an application called com.udinic.keepbusyapp. In this case, another application was the reason that the processor was loaded without paying attention to your application for some time.
While this scenario is usually temporary, as other applications usually do not steal the processor in the background (... right?), But such threads may come from different processes in your application or even from the main process. Thus, Systrace is a review tool, but there is a limit to how deep it can look. To find what takes our processor time, we will use another tool called Traceview.
Traceview
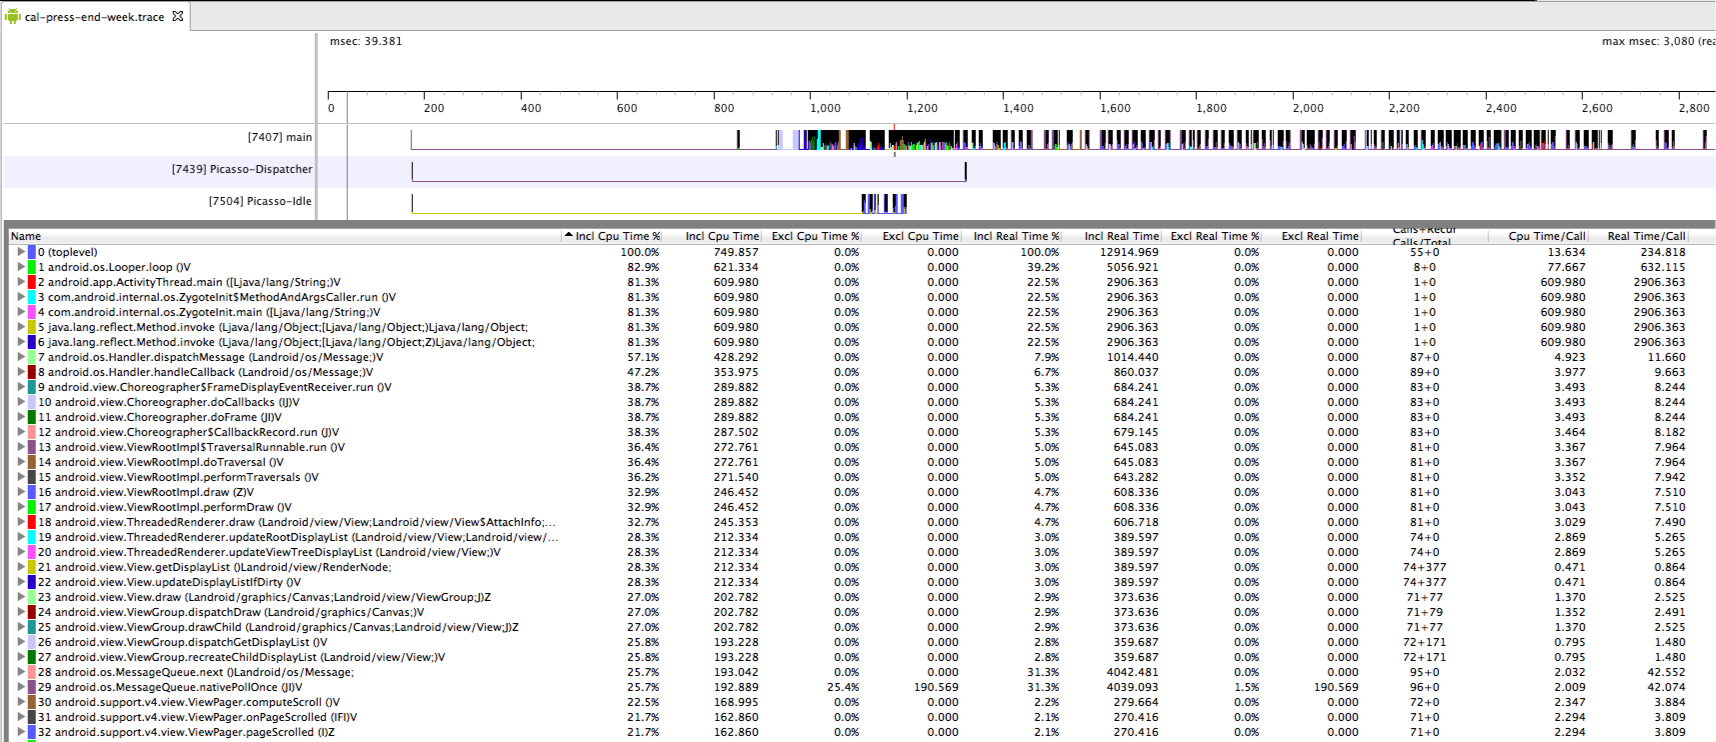
Traceview is a profiling tool that shows how long each running method lasts. Let's see what the trace result looks like: This tool can be launched from Android Device Monitor or from code. More information is here . Let's look at the following columns.
- Name - the name of the method and the corresponding color on the graph.
- Inclusive CPU Time - the time it took the processor to process the process and its descendants (i.e. all methods it called).
- Exclusive CPU Time - the time it took the processor to process only the method itself.
- Inclusive / Exclusive Real Time - the time that has passed from the moment the method was launched until the moment of completion. Same as "Wall duration" in Systrace.
- Calls + Recursion - how many times this method has been called, including the number of recursive calls.
- CPU / Real time per Call - how much on average did the processor / real time take to call this method. The remaining fields show the cumulative time of all method calls.
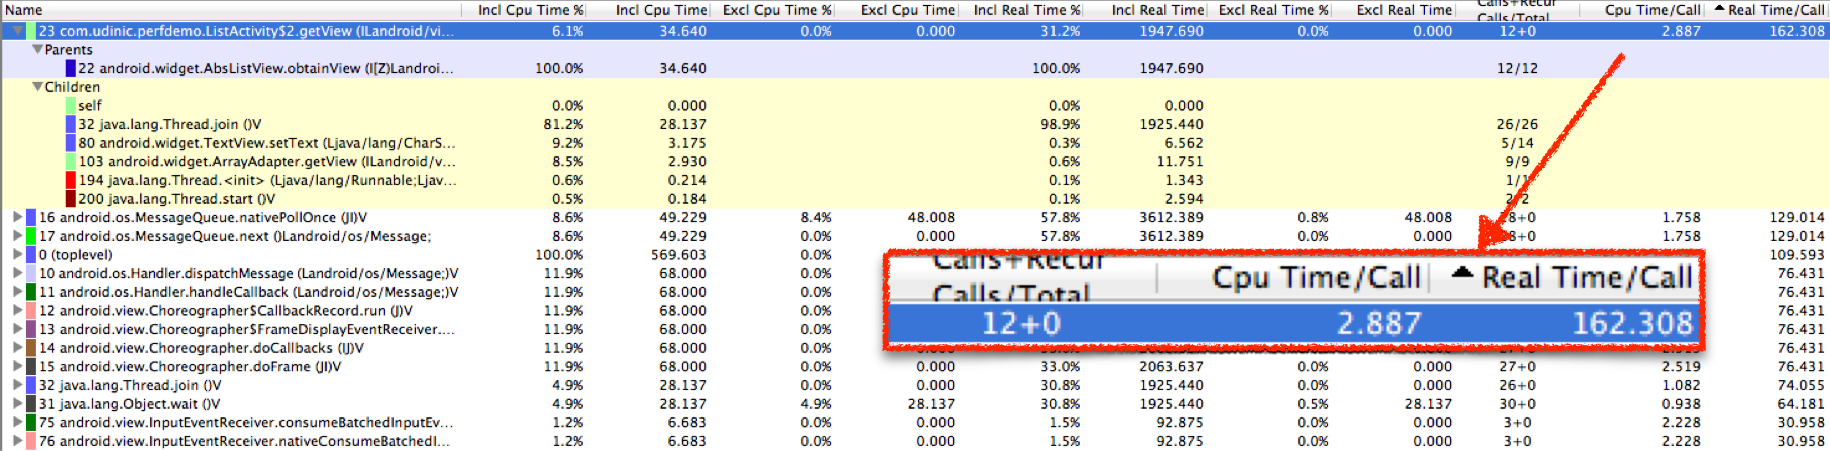
I opened an application that had problems with scroll smoothness. I started tracing, leafed through a bit and settled on one line. I came across the getView () method and opened it, and here is what I saw: This method was called 12 times, the processor spent about 3 ms for each call, but the real time it takes for each call is 162 ms! Definitely a problem ... Looking at the calls from this method, we can see how the total time is divided between different methods. Thread.join () takes about 98% of real time. This method is used when we want to wait for the end of another process. One of the other descendants is Thread.start (), which allows me to assume that getView () opens the stream and waits for it to finish. But where is this stream?
We cannot see what this thread does, since getView () itself does not do this work. To find it, I looked for the Thread.run () method, which is called when a new thread appears. I followed him until I found the culprit: I found that BgService.doWork () requires about 14 ms per call, and we have about 40 such calls! There is also a chance that each getView () will call it more than once, and this explains why each getView () call takes so long. This method takes a processor for a long time. Looking at Exclusive CPU time, we see that it uses 80% of the processor time!
Sorting by Exclusive CPU time is also a good way to find the busiest methods that can contribute to the performance problems you are experiencing.
Tracking such critical methods as getView (), View # onDraw () and others will help us find the reason why our application is slow to execute. But sometimes there is something that loads our processor, taking away precious processor cycles that can be spent on smoother rendering of our UI. The garbage collector works occasionally, removing unused objects, and usually does not have much effect on the foreground application. If the garbage collector works too often, this can slow down our application, and it is entirely possible that we ourselves are to blame for this ...
Memory Profiling
Android Studio has been improved recently, with more and more tools added to help us find and analyze performance issues. The Memory tab in the Android window will show us the change in the amount of data on the heap over time. Here's what it looks like: Where we see small drops in the graph, the garbage collector collects and deletes unused objects and frees memory on the heap. There are 2 tools available on the left side of the graph: Heap dump and Allocation Tracker.
Heap dump
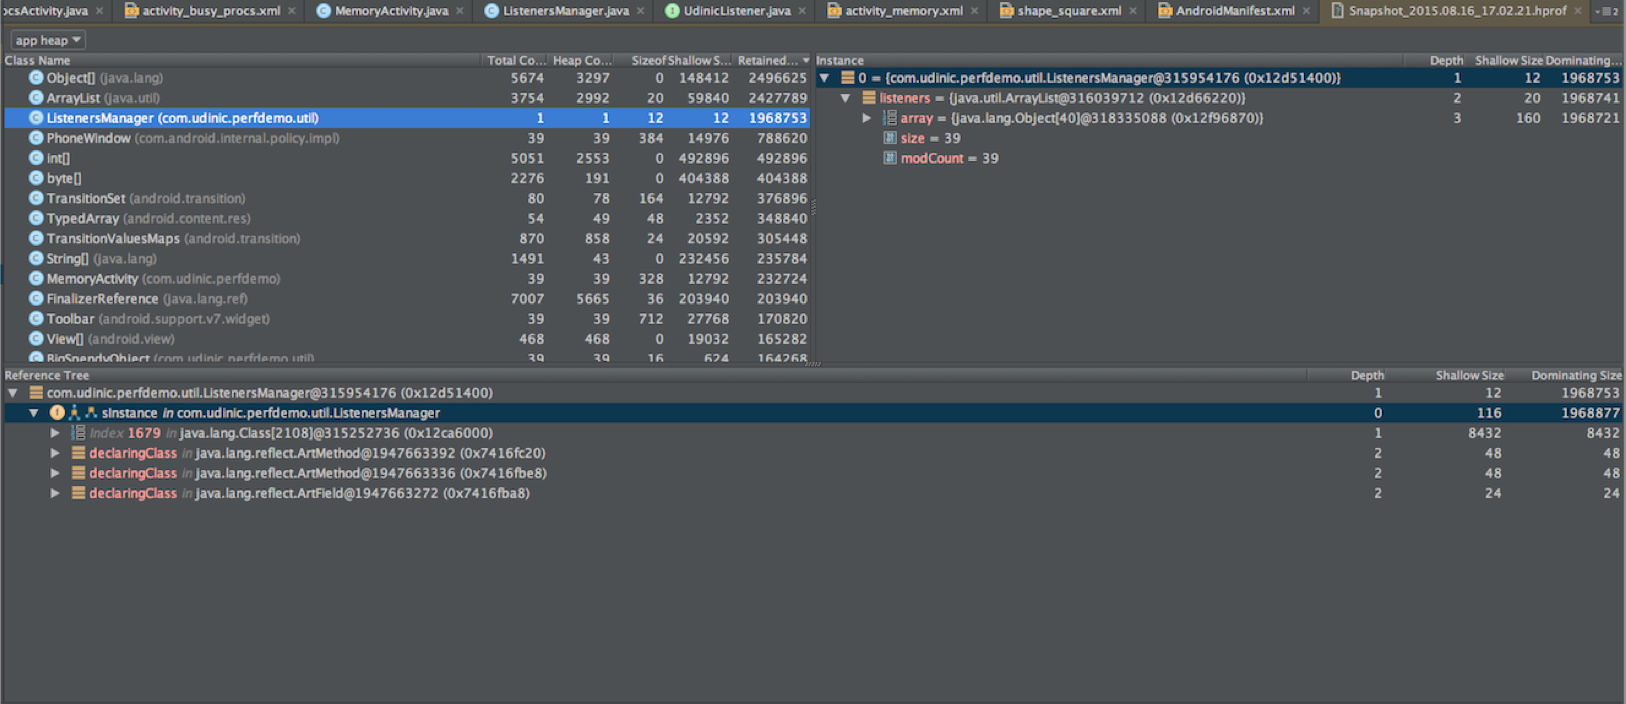
To examine what is currently in our heap, we can use the left button Heap dump. This tool will take a snapshot of what is currently on the heap and show it in a special report screen inside Android Studio:

On the left, we can see a histogram of instances of objects on the heap, grouped by class name. For each of them, the total number of objects for which memory is allocated, the size of these objects (Schallow size) and the size of objects stored in memory are indicated. The latter tells us how much memory can be freed if instances of objects are destroyed. This gives us an important insight into the memory footprint of our application, helping to identify large data structures and relationships between objects. This information can help us build more efficient data structures, remove relationships between objects, to reduce memory consumption and ultimately reduce memory as much as possible.
Looking at the histogram, we see that MemoryActivity has 39 instances of objects, which seems strange for activity. Selecting one of its instances on the right, we will open the list of all links of this object in the base tree below. One of them is part of the array inside the ListenersManager object. Looking at other instances of activity, it turns out that they are all stored in this object. This explains why an object of this class uses so much memory.
Such situations are known to be called a “memory leak”, since the activity was clearly destroyed, but unused memory cannot be cleared by the garbage collector due to this link. We can avoid such situations if we are sure that our objects do not refer to other objects that survived it. In this case, ListenersManager does not need to save this link after the activity has been destroyed. The solution is to remove the link before the class instance is destroyed in the onDestory () method.
Memory leaks of other large objects take up a lot of space on the heap, reducing the amount of available memory and causing frequent calls to the garbage collector in an attempt to free up more space. These calls will occupy the processor, causing a drop in the performance of your application. If the amount of available memory is not enough for the application, and the heap size cannot be slightly increased, a more dramatic outcome will occur - OutOfMemoryException, which will lead to the application crashing.
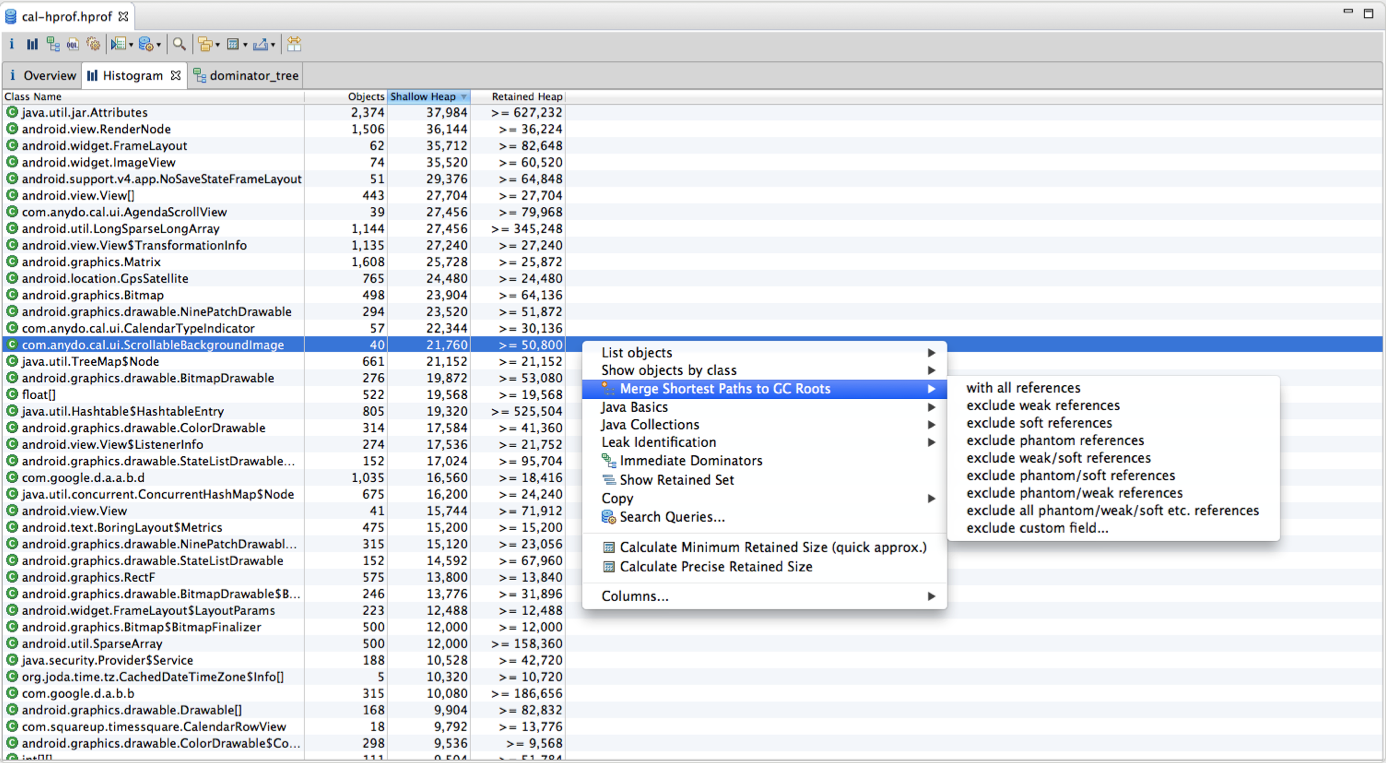
A more advanced tool is the Eclipse Memory Analyzer Tool (Eclipse MAT): This tool can do the same as Android Studio, in addition it can detect possible memory leaks and provide a more advanced search for objects, such as searching for all Bitmaps larger than 2 MB, or all
empty rect objects .
Another great tool is the LeakCanary library , which monitors all your objects and makes sure that there is no memory leak due to them. If this still happened, you will receive a notification to know where and what happened.
Allocation tracker
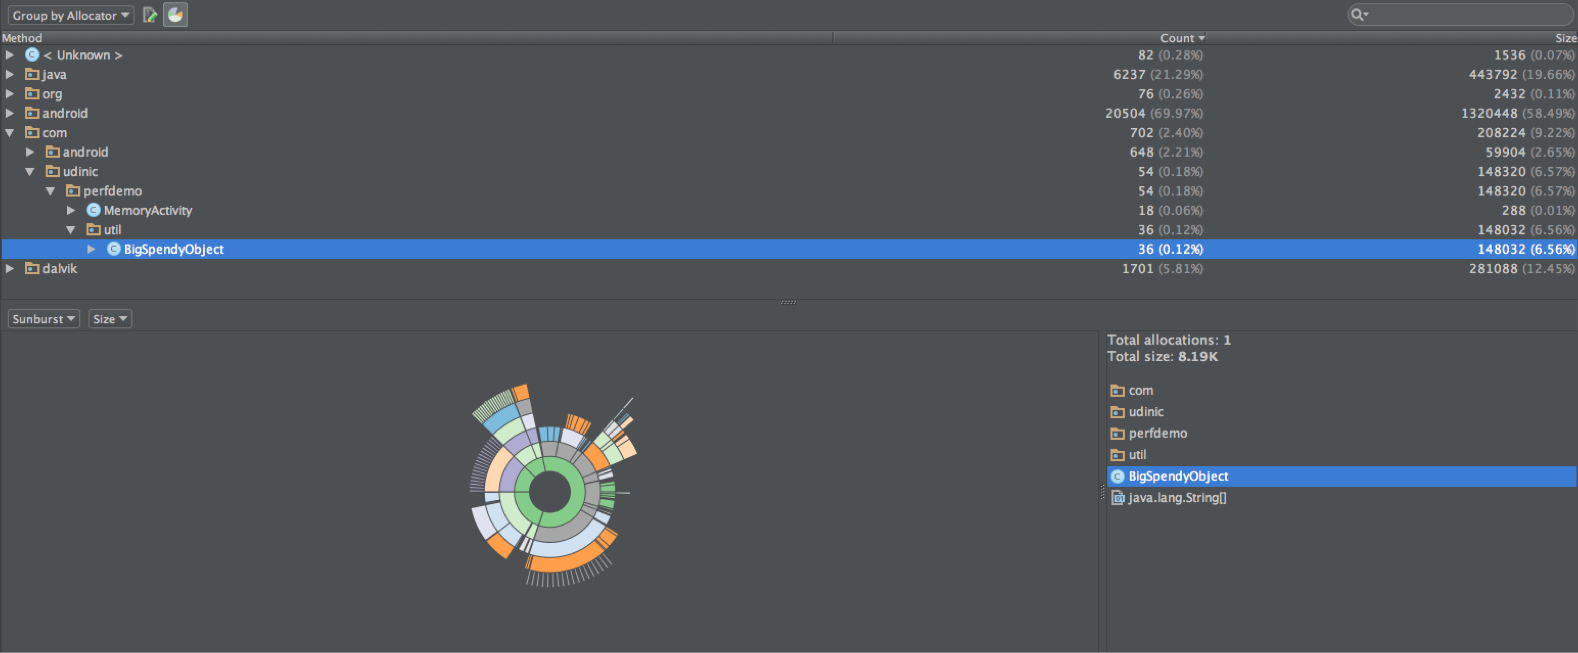
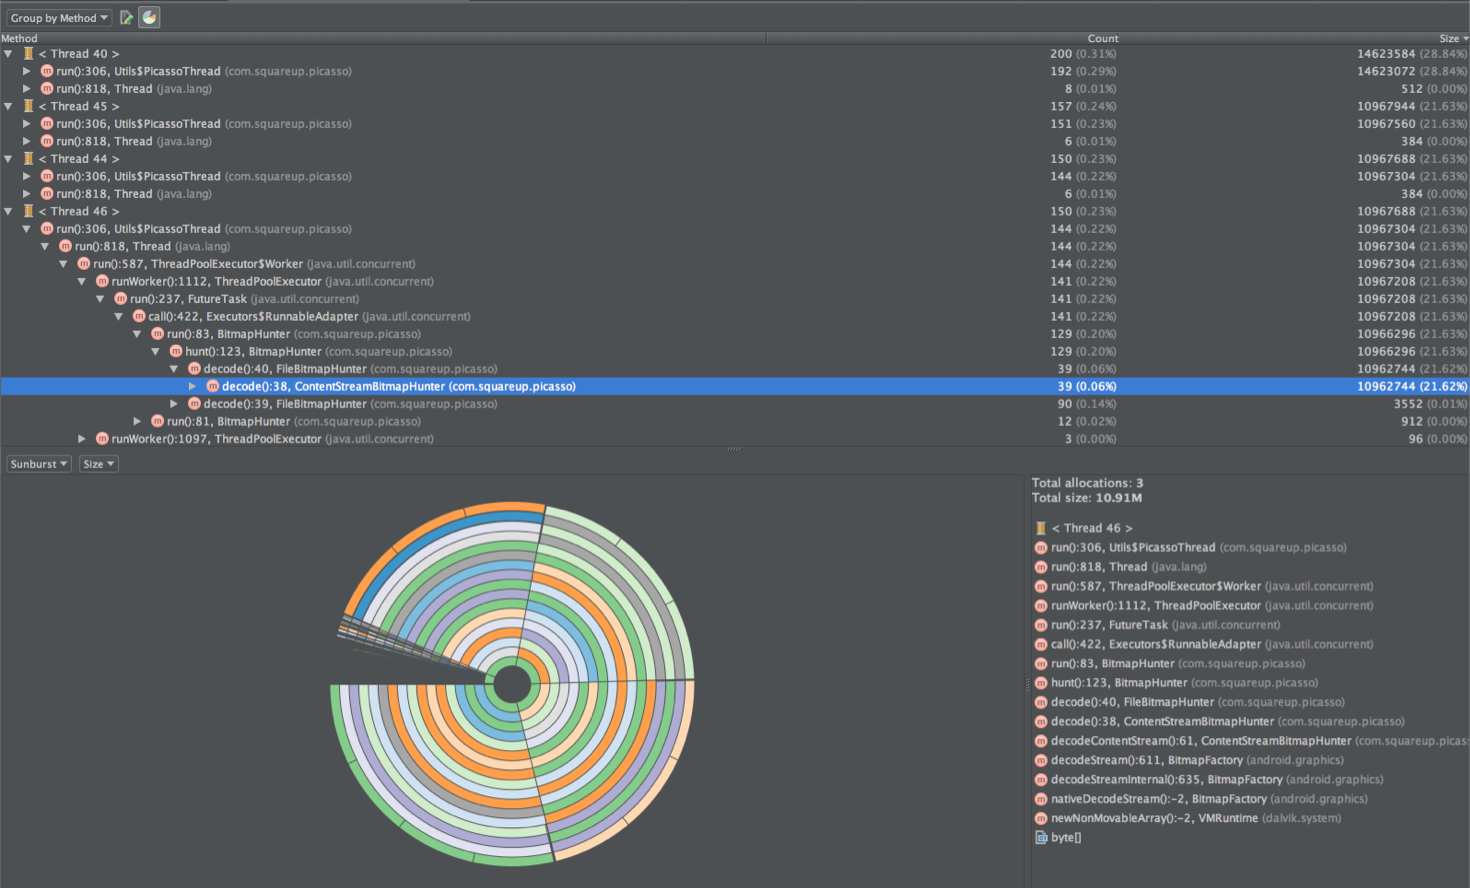
Allocation Tracker can be opened / closed using the button to the left of the memory graph. He will compile a report on all instances of the class allocated in memory for this period of time, grouped by classes: or by methods: There is also a good visualization showing us the largest instances. Using this information, we can find methods that take up too much memory and can generate many garbage collector calls. We can also find many examples of objects of the same class with a short life cycle in which we can use the Object Pool to reduce memory allocation. Continued in the second part . PS The report was recorded on video and you can watch it here:
Slides are also available .