Why do we need business intelligence systems
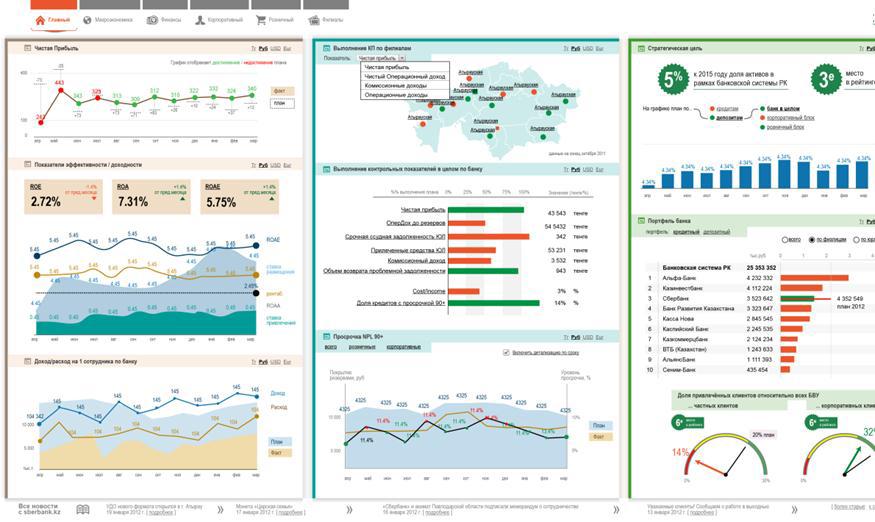
Visualization in business intelligence is very important. For example, the concept of these graphs was drawn together with Infographer.
The problem with specialized software for business analytics is that it stands like an airplane - and is needed only when you have a large, very large company with the appropriate amount of data. On the whole, there are not so many specialists on the market now who have tried such systems, have experience working with them, and can clearly say that this is why it is needed and what it will give after implementation.
The first and foremost application of business analytics is to bluntly be able to build arbitrary reports on the forehead while the heads of departments or members of the board of directors confer. One of my favorite examples is from which factory to deliver vodka to stores: from distant (expensive logistics and 2 weeks on the road), but cheap at the cost of production or from the nearest (1 day), but expensive?
It is clear that you can dig deeper and answer in a week. But more often, faster modeling and not hundreds of scattered reports are needed, but a single environment where a financial specialist can simply take and get the necessary data without involving the entire IT department. There are also specific tasks that these and related systems solve. I'll tell you now.
More typical tasks
In general, right away: we are not talking about specific solutions, but about what an enterprise can get from implementing Business Intelligence and related systems. It is clear that when data begins to be collected and analyzed, it is logical to use a lot of them where. The first main question is data collection, the second is the methodology of what to do with this data in general. Let's get started.
- So, the first is reporting. Everything is quite simple here: BI acts as a single data repository for all subsystems and can combine them, process them in dependencies, and produce the result. There is no question of verification: if you have ever summarized a report of a large production company (for a month of work like this), then you know that 20 days out of 30 is a check whether everything was done correctly. Because the price of an error is good if a couple of millions, and good if rubles.
- The second task is data processing and cutting regular reports for all departments of the company . Of the most unusual, we used the BI system in order to obtain census data, poll it, supplement, restore, hypothesize, check, process and cut thousands of reports for all regions, cities and villages .
- The third task is to speed up processing . Previously, a report was made once a month, but now in real time (this is a very, very critical difference for many areas of the business).
- The same class of systems is used to clear Big Data data.and, as a result, to reduce overall operating costs, increase revenue and increase business competitiveness. In general, this is done due to the fact that you begin to make more correct decisions. Mathematically sound as above with vodka. Of the examples of the same class of tasks, retail in the USA loves adding customer profiles (for example, due to behavior on the company's website and favorite goods, as well as information from social networks), so that, for example, later it can offer baby food to pregnant schoolgirls. They say sales are growing on these offers from 1 to 10%. Banks are eyeing transactional analytics in real time: paid for a ticket to Europe - the bank immediately offered you insurance. The departments are talking about the recognition of faces by surveillance cameras, comparing them with the database of individuals and profiles in social networks and building optimal offers based on extended information. In one large retail chain, at least in several large stores, well-known thieves are automatically recognized at the entrance by their faces using video analytics.
Of course, if the task is a one-time task - please, the specialist from the IT department, the script - and it's solved. If the task is frequent, but not difficult - a macro in XLS. But for large geographically distributed companies, where the same logistics determine the profitability of the entire business, there may be up to millions of variables at the start. Accordingly, SAS, SAP, Oracle, RapidMiner, Prognoz, Tableau, Qlik, Microsoft, Huawei, EMC, JDA, IBM and others have different solutions for this.
In Russia, solutions based on open source products are often used, “tailored” by an integrator for a specific company. There are also SaaS models (for example, from our cloud one production company consumes such a service for planning production and distribution of raw materials across production sites).
Company performance evaluation
Naturally, the meta-task of BI and related solutions is an assessment of the company's effectiveness. The effectiveness of the company is evaluated according to a certain model, which is determined by a number of target functions.
Roughly speaking, there is data, but there is a methodology for evaluating this data. And a model of the relationship of the various components with each other.
We collect actual data values using the classic Business Intelligence systems. For many, BI ends up with this - it is often a problem to combine supply and production corny because they are made in different places and systems.
Further, the data is driven into the model of the enterprise. The classical methodology - the same BSC - was created back in the 87th year, and has not changed much since then. I mean, updates and forks are in stock, but the principle is the same everywhere. In short, the company's activities can be decomposed into 4 components: the financial part, the client part, personnel and reserves (that is, personnel) and a development strategy. Even state-owned enterprises are valued in the same way, only instead of profit there falls into a given budget.
The beauty is in the detail. The fact is that when auditors watch the company or when something is discussed on the board of directors, a maximum of 20 aggregated indicators such as net revenue, turnover, etc. are usually evaluated. These are the indicators that go to shareholders in the reports and are given recommendations. To evaluate not on sensations - but for yourself every day indicators in the form of numbers.
And BI allows you to take a report and not just get a line of “total”, as is usually done, but see what each indicator is made up of. And then - fasten to the model a variety of things that are recounted almost in real time.
Indicators are cascaded to people - and the motivation system is turned on. For example, if the shareholders decided that after 3 years the profit should be 20% more, it is easy to build state A and state B. And the model of the transition in 3 years from state A to desired B. At the end of the year (quarter, day), you can see operational indicators and understand whether you dig there or not. An indicator model can decompose the entire transition process and there will be a strategic map of how to change. Each leader will have a plan on what to do.
Once again: there is a strategy in which at the macro level it is agreed what to do. And there is automation of operational activities - and we can work with it too.
Sketches of life
A simple example: in the regions, the report is collected by hand and sent as 1C export. To understand that there is a real dark forest, one can only say whether it is good or bad. And what is good and what is bad - you have to go and dig. Now we give a tool for the leader to have the entire operational card there. He immediately sees from the reports where it is good and where it is bad - and where his intervention is required, he looks at the entire accounting level to the very bottom, if he wishes.
Here is another example.For the company, there are indicators that the parent western company releases - these are the strategy and operational indicators. There are leadership motivation systems that allow you to reward those who dig in the right direction. Last year, they decided to lower it to the level of each employee - they needed a powerful IT solution. Plus, make a link between the data of the production workshop and the service - for example, if they produced little, this year, few are serviced, and this is not a jamb of services, but a reaction to the realized volume of production. We prepared the project methodology on the product stack. Integration - visualization - and an addition to payroll.
In retail, such decisions often ultimately translate into detailing to employees. For example, in the pharmacy above the checkout counter, from the inside, “Today you need to sell another% N vitamins” may light up, and the cashier will gladly offer them to everyone. Like, haven't you forgotten the vitamins?
At the global level, the same company that takes bananas to us in Russia uses weather forecast data for a year in its Business Intelligence. Seriously, for one year in advance they are trying to predict what will happen to the weather. They need it by leaps and bounds, and in clusters - and as a result, they know almost exactly how much bananas will cost next year in Russia.
Another company uses a personnel assessment system for a number of formalized indicators. For example, how old is the “average” person of the average term in this position, whether he merged the data to the left, how he went about the projects ... As a result, the two main metrics are “there is a future” or “there is no future”. And the second - separate - is a threat to posts like the vice president. And the employees quickly realized that HR was starting to send the most “working" to Europe to learn English. Personnel officers themselves see for each employee a forecast of his departure. The question, of course, is choosing the right model and collecting data (the same pass systems allow you to receive information about lateness). But in general, the bases for all these monstrous complexes have long been laid in IT. You just need to learn how to use them.
It is important to note that in Russia the process and the person are not always distinguished. We like to search with the help of BI guilty. In the West, they first check whether the process is right. And if the process is right - then they begin to think about something that someone messed up. Change the process, not the person. This intercultural difference resulted, for example, in the fact that in one company the boss introduced BI only because it was hard for him to fire people (and they rested on the Labor Code only in the way). They made a performance evaluation system that itself at the end of the month printed out the dismissal orders was the most ineffective. And correctly formalized all this legally.
More specific task examples
Consider a simple example - the supplier announced an increase in prices for all products by 10% starting in 2015:
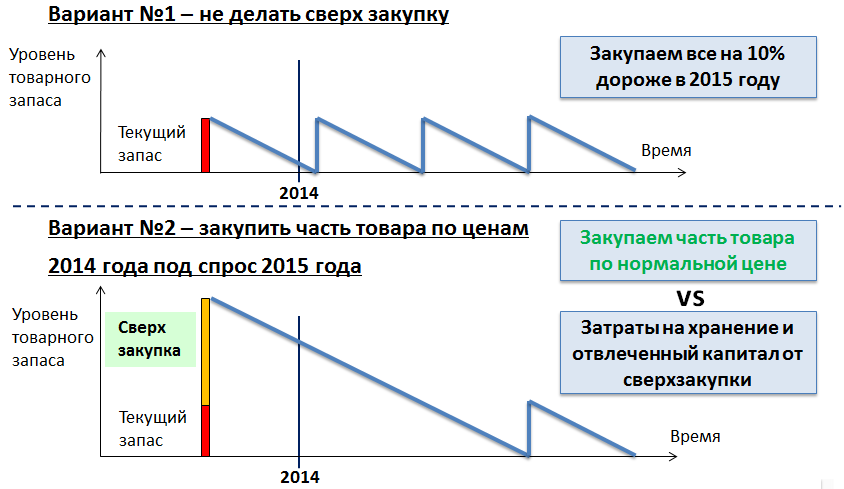
As a result of the simulation, an optimal procurement plan was obtained by the end of 2014 for each commodity item, providing maximum savings taking into account future price increases and minimum costs for storage and immobilization of assets in stocks.
If your CFO wanted to get what-if analysis (for example, what happens if you need to switch to another supplier - with known parameters), in theory this can also be done in BI or a logistics optimization system.
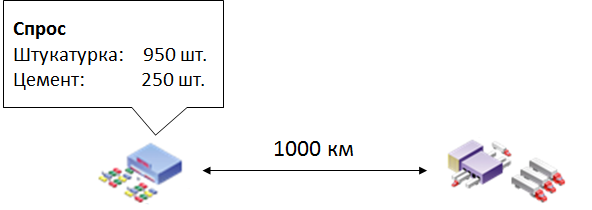
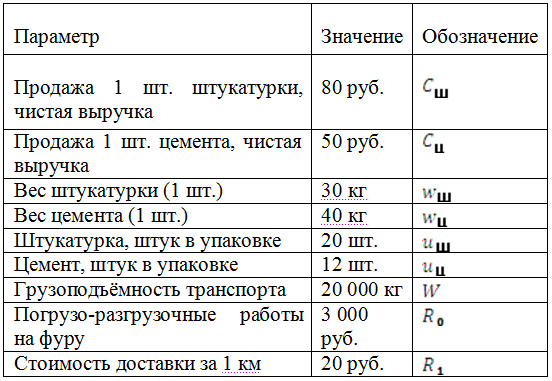
The second case - imagine the simplest situation. The company has a distribution center (RC) and a storehouse where goods must be delivered from the RC. For simplicity, there are only two products - cement and plaster. The weekly demand of the store and the volume of capacities that are at our disposal are known - these are trucks with a carrying capacity of 20 tons. All other reference data are shown in the diagram below.
We are faced with the task of determining the number of vehicles and their loading in order to maximize profits (in fact, there can be many criteria for optimization - this is both cost reduction, minimizing delivery time, and others).
The optimization criterion chosen by us is formalized in the form of an objective function:

In other words, we want to select such delivery volumes and (number of packages of each product) in order to get the maximum profit from the sale of goods.
Here is the total cost of cargo transportation (in our example, fixed), but, generally speaking, this is not necessary. We also need to comply with a number of restrictions. For example, the total weight of the goods transported by the truck should not exceed its carrying capacity. The total supply for each product should not exceed its demand for this product (according to the conditions of our task, this is not always the case in life). There are several points that are understandable to any specialist, but absolutely indifferent to the computer. For example, it is important to specify that the supply volumes of each product are non-negative. Of course, the number of product packages must be an integer. Then the final system is compiled and decided. This is a classic mat programming that is good to do with Matlab or Tungsten's grandfather.
From our source data, we found out that the second truck carries 18,000 kg of goods, and delivery will bring 11,400 rubles of net profit. But at the same time, you can run a what-if analysis and be surprised to learn that if 19,680 kg were shoved into a truck at some point with an inhuman effort, the expected profit is 13,300 rubles (1,900 rubles more, taking into account the discount on surplus goods). And this is an occasion to think about the fleet used by the company.
Implementation of the BSC (KPI, etc.)
In banks, as a rule, the management model cascades well from the upper level. Everything is linear there, a lot of data is collected, and therefore the introduction of the MTP gives a decrease in the mess in the branches. Easy to scale. There is experience, and the bank usually brings the methodology. We carry out purely technical and integration work.
In the public sector, the issue is now in its infancy, as in many other areas of automation. But the structures have grown to staff assessment. For example, 2 and a half years ago, sets of metrics for all subordinate organizations were launched. And now this topic is relevant. Another area is the ranking of universities, there are about 40 performance indicators. They simply did here: they collected data on educational institutions, counted, and then simply demolished ineffective ones.
Similar systems of MTP at mobile operators and retail, at the largest manufacturing companies. Oil workers love this, they have the whole salary is considered so.
To make it clear how this works with automation, and not as before, there is a simple example - earlier, up to 6 months, it took to agree goals for store managers on the same network. At 17 levels. Now - only 1 month.
In another company, 1,000 tops were evaluated by a variety of indicators. It turned out a report of 17 pages, with which they went to the carpet, how much each earned. And the leader decided: really earned or crossed out. Everything was decided by carpets: finances came from accounting systems, transferred to paper, and also, on carpets, planned values for indicators were given.
Another our solution works on forecasts of passenger traffic and from this builds exactly the number of cashiers that need to be changed so that they do not stand idle, but also do not work for wear. By the way, there is another interesting thing - the evaluation of the queue at the cash register for video analytics.
Overall market
Despite the crisis and the period before it, the Russian market of business intelligence systems has been growing in recent years (for example, in 2014, our CROC business analytics line grew by almost 1.5 times, if we count in rubles). The explanation is very simple: you need to determine ways to optimize business processes, reduce costs, identify new business development strategies. When a company is large, the cost of implementing a solution is obviously less than those 8–13% of efficiency that (based on world practice) can be won.
In the medium-sized business, among BI solutions, those that are more relevant for generating reports than forecasts are more relevant. Although open source gradually penetrates all sectors of the business, and the range of tasks is expanding.
PS Just in case, my mail, if you have a question not for comment, here: Brahew@croc.ru