We look at the tools for monitoring distributed applications
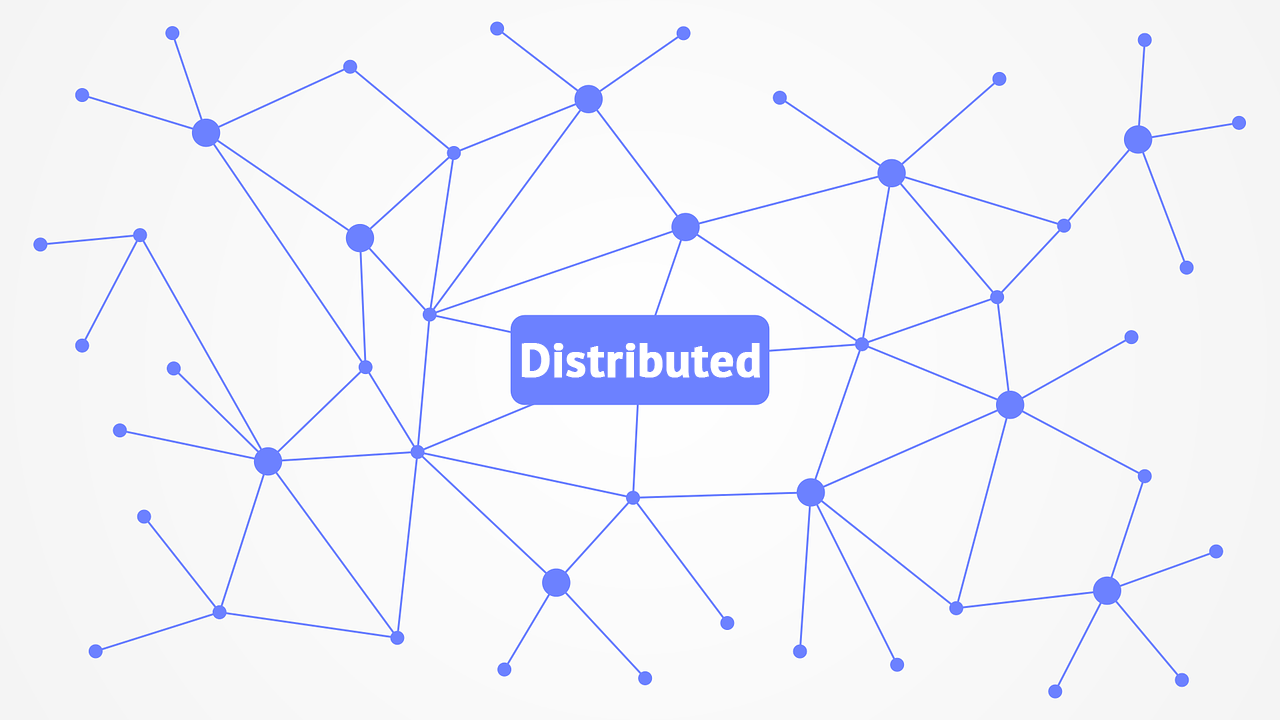
When the application was monolithic, and suddenly, once it became distributed, another unknown is added to the availability calculation formula — the network one. Because of problems with calls between components, applications often fall down and start jerking their feet. And finding out the reasons for the unstable operation of a distributed application is another problem. Additional confusion in the structure of the application introduces conditional kubernetes, which at its own discretion can arbitrarily distribute conditional pods on conditional nodes. I am writing “conditional”, because in place of kubernetes there can be Swarm and Openshift, and so on and so forth.
I mean, without normal visualization it can be very difficult to figure out where the temperature is. Under the cut, my idea of the potential capabilities of tools that can draw an application map and highlight areas for the application of plantain, as well as a list of these tools with screenshots.
Let's first understand what is desirable to see on the application map, then consider the approaches to monitoring and then move on to specific vendors.
What do you want to see on the application map
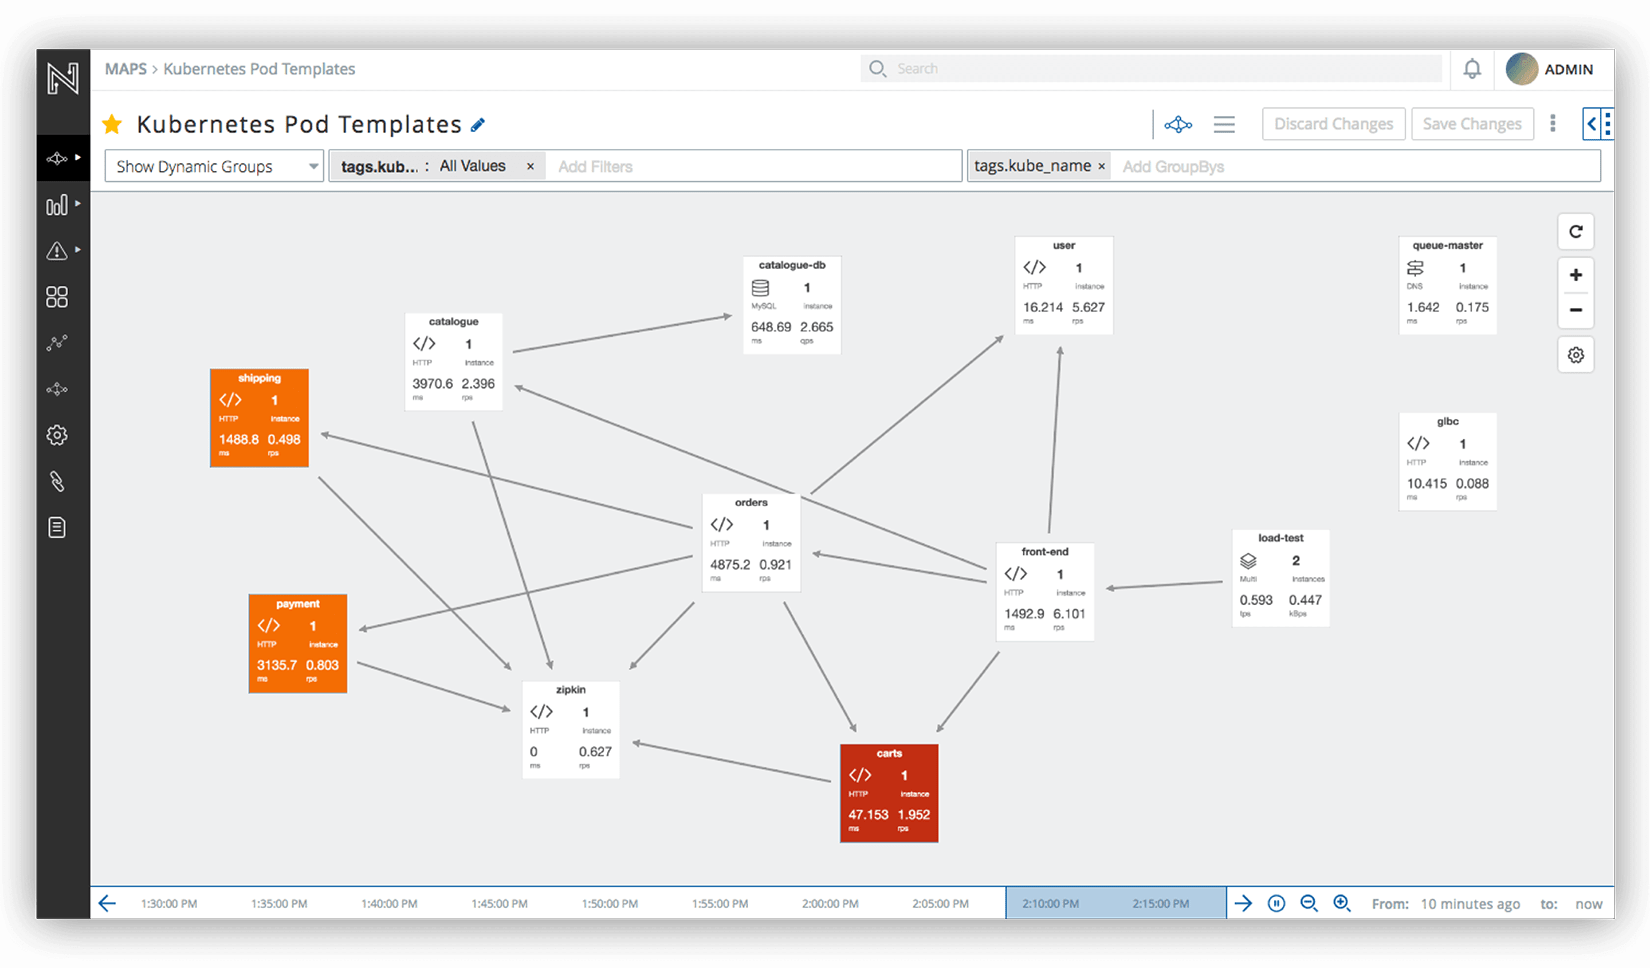
The first thing that comes to mind is the possibility of grouping the nodes of an application according to certain criteria. For example, I say that in this group I have a frontend, and in this backend, or here I have copies of the Payments service, and here Shipping. Well, and so on. And the people who are responsible for this or that part immediately see the full picture of what is happening within their area of responsibility.
The second is the separation of the application by levels with the ability to see, for example, in terms of infrastructure, service, service instances, etc. As well as in the first case, it will help to identify the problem layer.
Third- the outputs and inputs of these nodes, including the connections between them. On these threads you want to see golden signals (golden signals), which Google describes in Chapter 6 of Monitoring Distributed Systems of the book Site Reliability Engineering. I have already published the translation of this chapter in a blog on Medium . The signals are as follows: latency, traffic (throughput), errors (error rate) and saturation.
Perhaps I did not take into account something. Please go to the comments if you think that there are not enough other important things.
What do different monitoring approaches conceal?
I don’t know what else to call it, so I’ll call the approaches agent-based and agent-free monitoring. Now I will explain xy from xy.
Agency monitoring
Agent monitoring means the need to implement special monitoring agents in a controlled application. Agents embed trace ID in packet headers.
This type includes APM monitoring solutions and all those that are embedded by injecting the SDK into the application code.
Pros: helps with finding the root cause of the problem, the headers can accurately track the path of the transaction.
Minuses: possible overheads due to the modification of the algorithm of the application, the impossibility of embedding in outdated applications, support for a limited set of programming languages
Agentless monitoring
Monitoring without application modification. Logs, operating system level tracing, network traffic monitoring can be attributed to this type.
Pros: monitoring by monitoring various frameworks and programming languages, can work where trace ID injection is impossible, there is no overhead on a controlled application.
Cons: Without a trace ID, it can be difficult to restore the business transaction context, the inability to listen to traffic if SSL encapsulation is configured and there are no keys,
What do vendors offer
Vendor disassembled on the basis of agent / agentless, the other characteristics you can ask in the comments or personal message. I had the greatest experience with Instana, Appdynamics and New Relic, if you want to see it - I can help with demo licenses for a period longer than 14 days (as they offer on their default sites).
Agency monitoring
Instana is a tool for monitoring distributed systems. The key feature is a single agent for all supported technologies and the collection of metrics once a second.

Appdynamics is a well-known APM monitoring solution. Able to build an application map based on calls between application components. Call monitoring requires an agent installation.
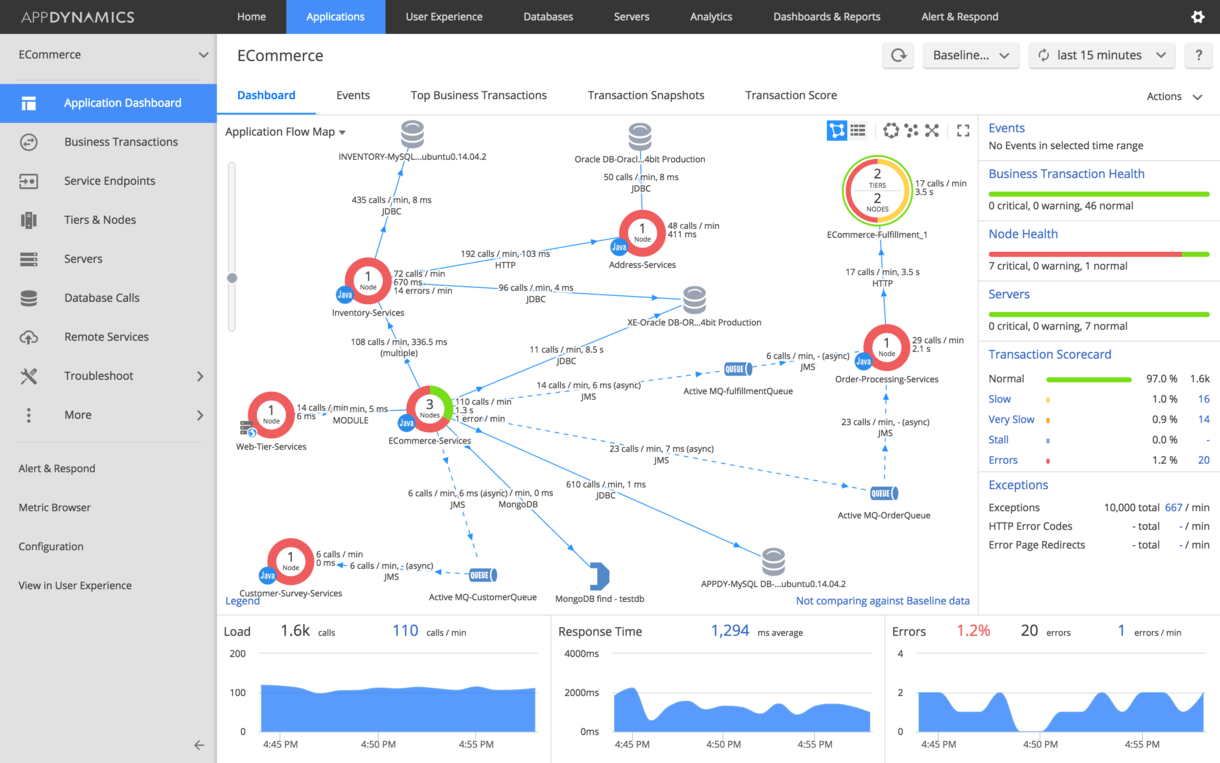
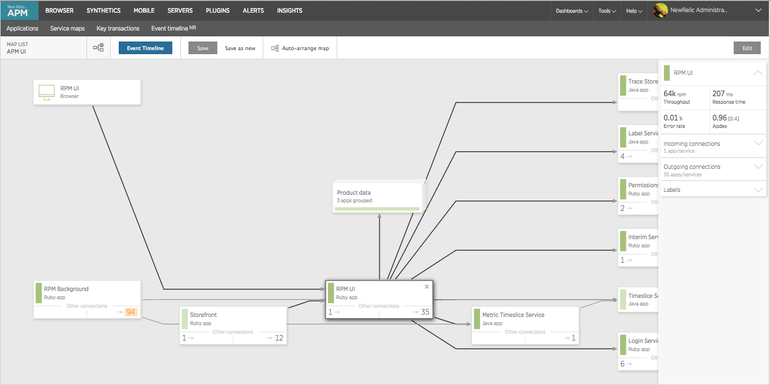
New Relic is a direct competitor to Appdynamics. The key difference is that it can be monitored only from the cloud (agents are also installed on the target servers). Builds a map of applications based on calls.
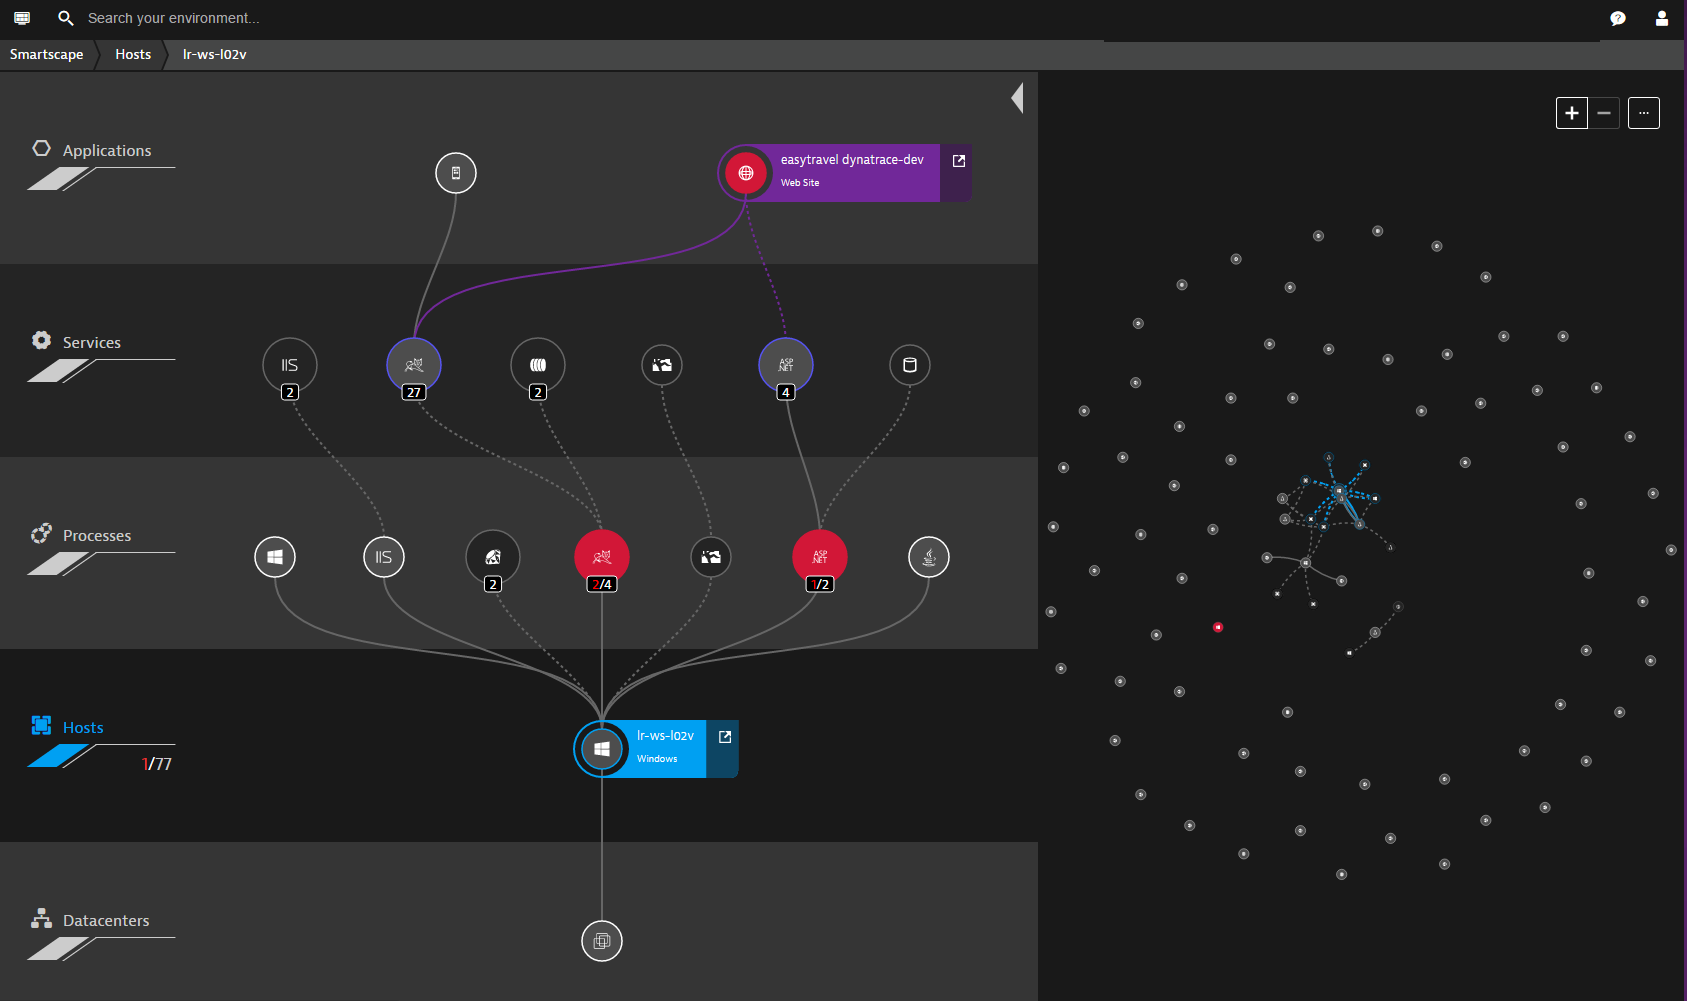
Dynatrace - APM monitoring tool. It supports monitoring of various programming languages and can work both from the cloud and on-premise.
AWS X-Ray- monitoring applications hosted on AWS. It supports the visualization of the application map, requires the installation of its own SDK.

OpenTracing - API for tooling distributed applications. Many commercial and non-commercial solutions work on the basis of this API.
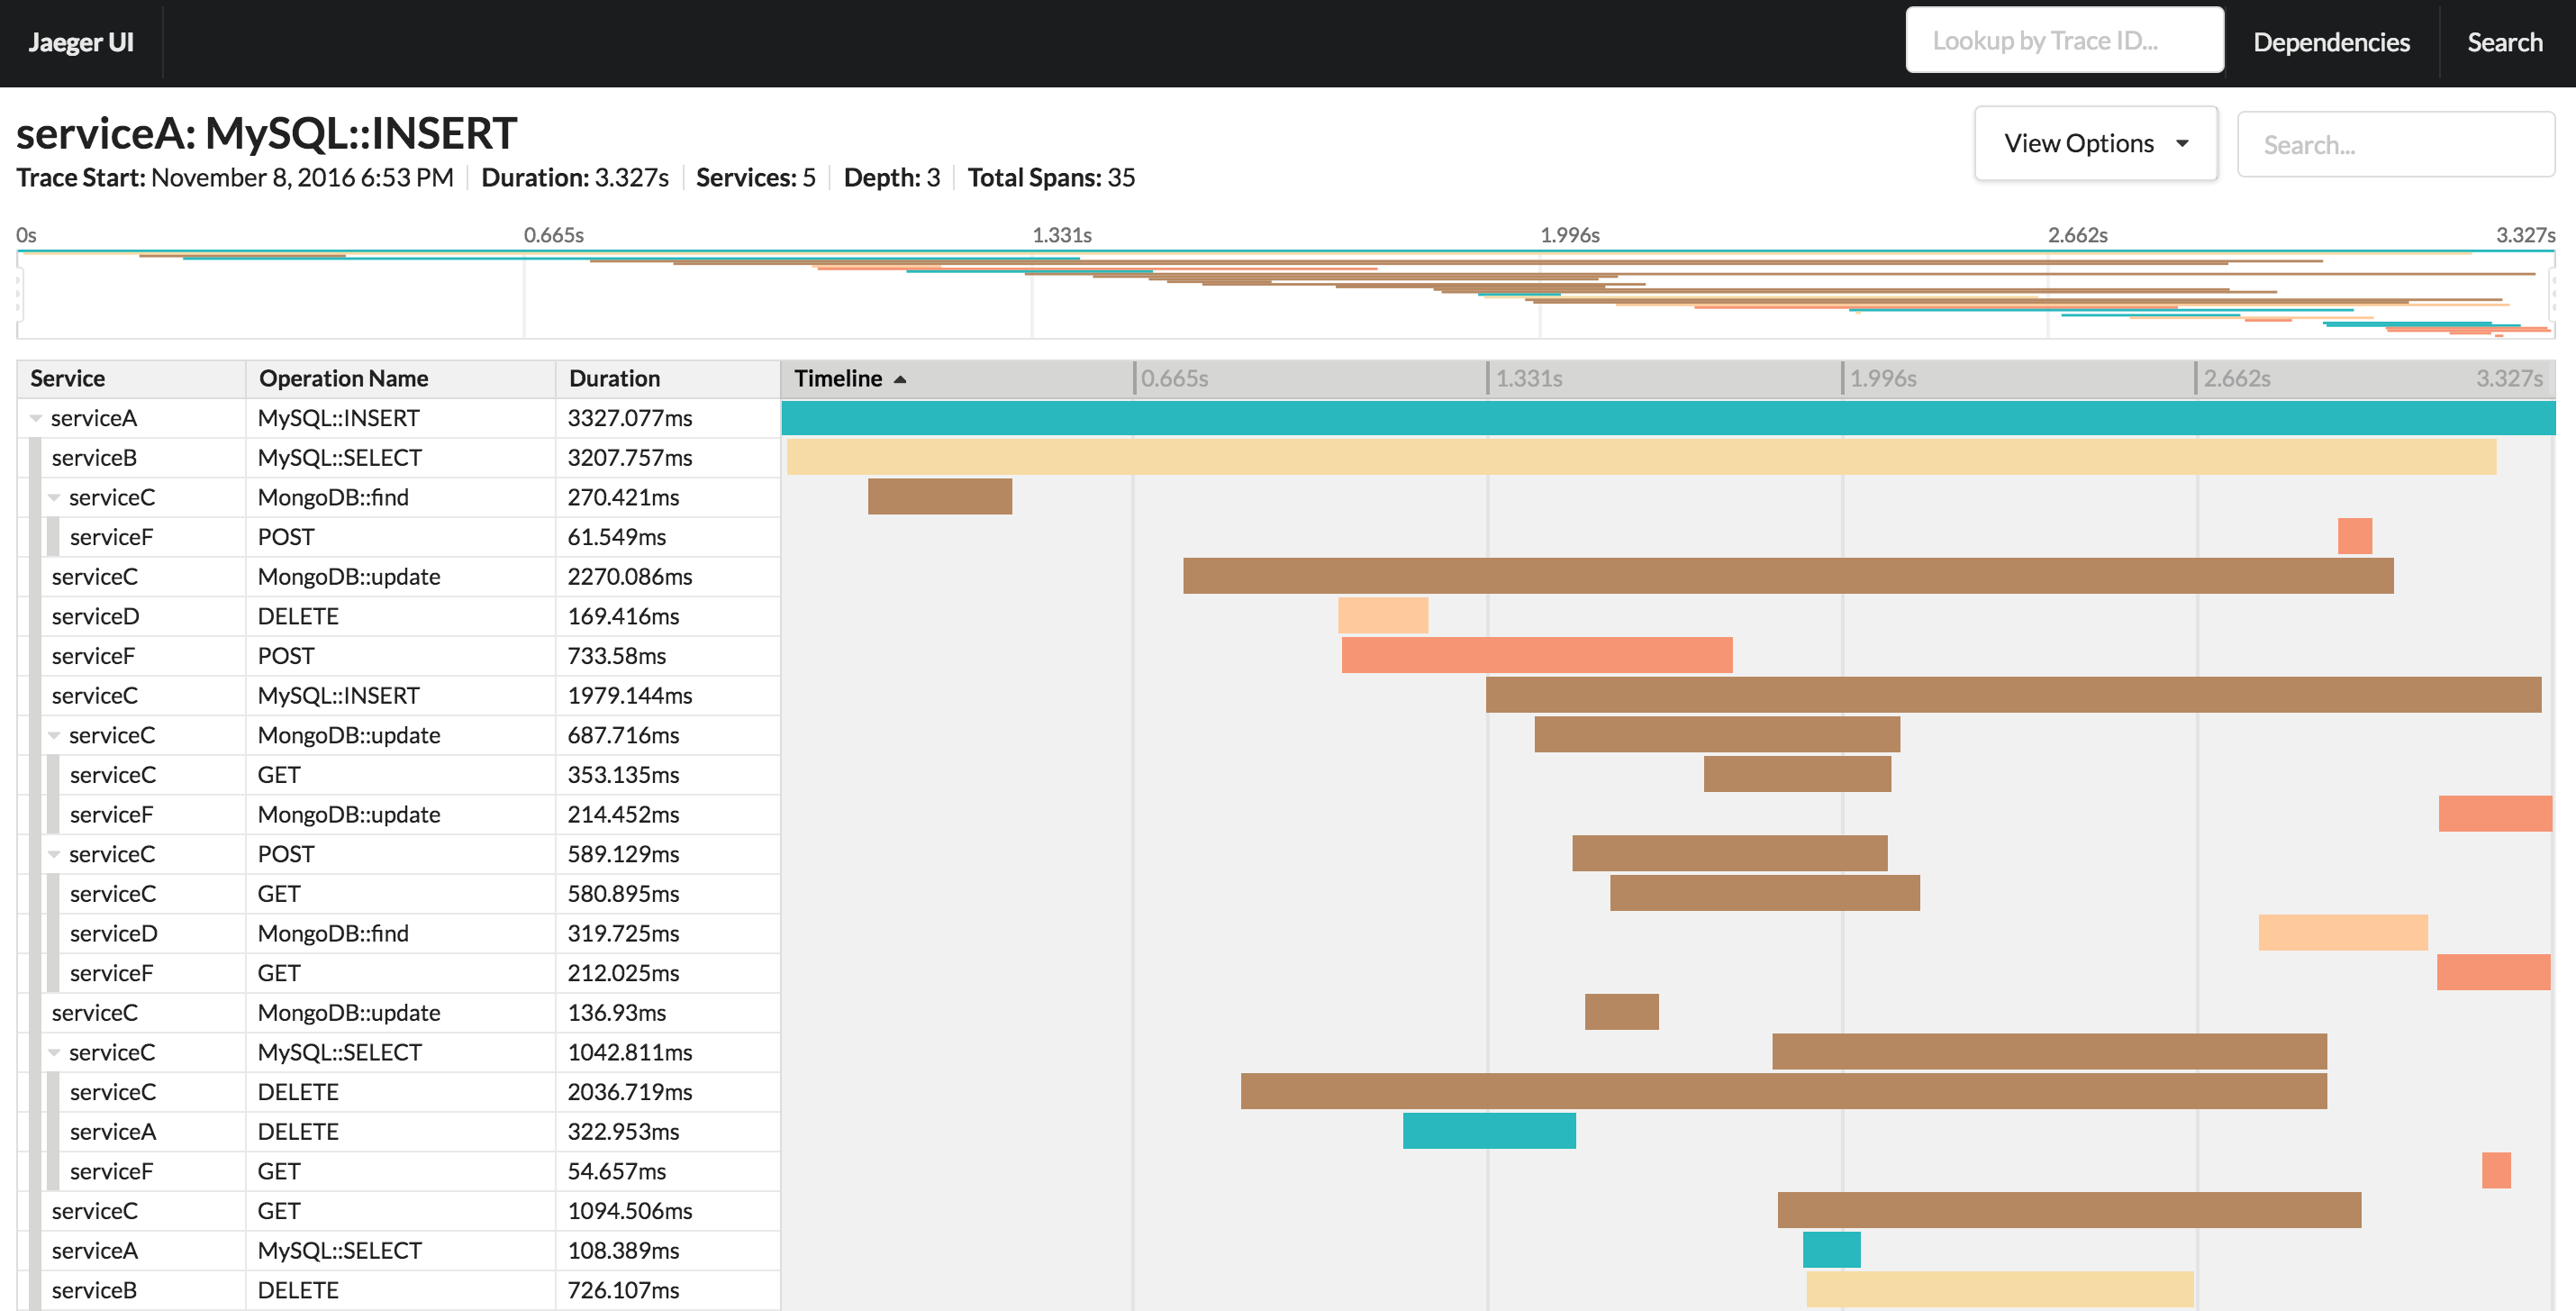
Jaeger is a free open source tool for tracing. Built on the basis of OpenTracing.
Datadog APM is a commercial tool for monitoring distributed applications. Works on the basis of the mentioned OpenTracing.

Agentless monitoring
OpenZipkin is a free tool for tracing distributed applications. A feature of his work is to collect data on calls using the library of instrumentation and then send this data to the collector OpenZipkin.

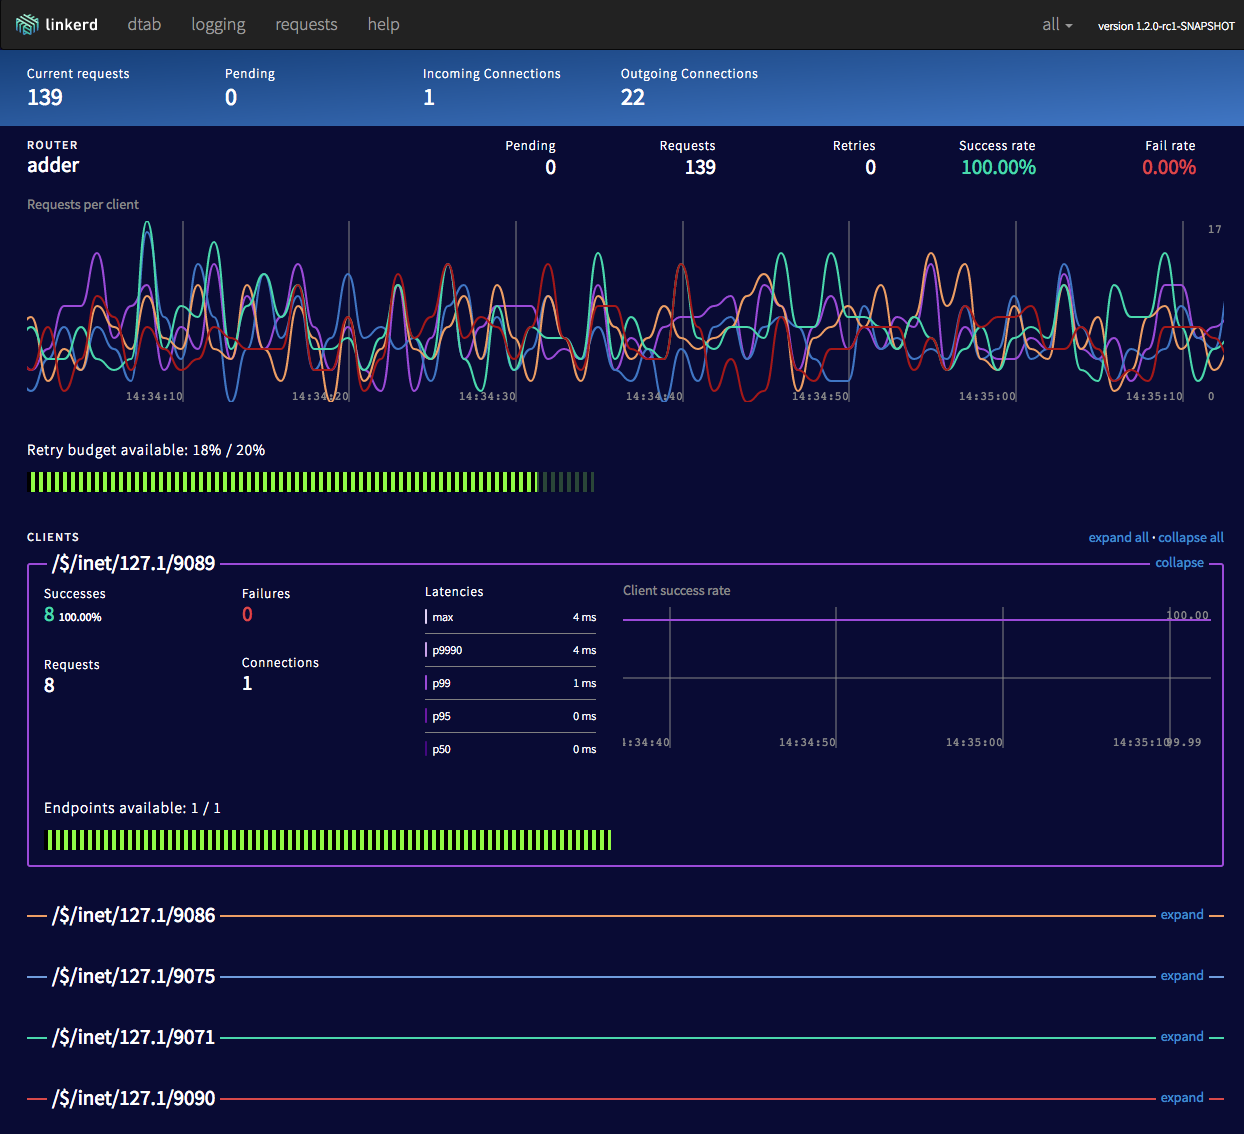
Linkerd is a free tool for tracing calls within the application. It is a superstructure over OpenZipkin, installed on the infrastructure kubernetes as a sidecar-container.
Envoy is a free tool. Works as a proxy to which call data is sent between application components. There is no own web interface, data can be obtained via HTTP GET requests or sent to statsd.
Netsil- A tool for monitoring distributed applications based on listening to traffic. It works regardless of the language in which the application is written.
Tell who used what and what impression left.
