What to look for when choosing a logging system, and why we stopped at ELK
There are a huge number of logging systems on the market, both open and proprietary. Each of them has its own functionality, its own advantages and disadvantages.
Today we decided to share the experience of choosing a logging system and tell why in 1cloud we stopped at ELK.
/ Pixabay / picupyourphoto / PD
When switching to production, applications turn into original “black boxes”. Their work must be constantly monitored to prevent and respond to potential emergencies, to catch "bottlenecks".
Logging systems are an indispensable tool, without which this process cannot be done. Conducting a detailed analysis of the data collected, you can identify the "intrusion" into the network, identify incorrectly configured equipment and take action promptly. Also, logging is a mandatory requirement when passing various kinds of certifications, such as PCI DSS.
To automate the logging process there are special frameworks: log4j, log4net, Retrace, Logback, Logstash and others - many of them. Their logging tools have separate development tools, for example, JDK -there is java.util.logging . Of course, the functionality of different logging tools is different, and the required set of functions must be chosen on the basis of business requirements. However, there are a number of common points that are worth noting when choosing a system for analyzing logs.
Simplicity is one of the key components when choosing a logging system. All developers in the team work with log frameworks, so the experience of using this tool should be positive and not turn log analysis into a nightmare. The framework API must be intuitive, so that everyone who has not worked with the system before can quickly figure out how it is set up and configured.
If we consider the open source system of logging, then it makes sense to assess the community that has formed around it. To do this, you can study how often it is mentioned on specialized sites ( Stack Overflow ), as well as in profile threads, for example, on Reddit. As an option - to see the popularity of the project on GitHub (the number of stars) and see how often it is entered into various collections of tools in the network ( like these ). Obviously, the larger the community, the higher the likelihood that you will be helped in case of unforeseen difficulties.
As for the choice of proprietary logging systems, here, first of all, it is worth looking at the speed of responses and the adequacy of the support service of the chosen solution, as well as its price.
Not all logging platforms are able to process large amounts of data and provide complete information about the systems used.
Before choosing a solution, you should decide which logs you plan to collect: HTTP logs (they will help you understand the behavior of users on the site), API logs (will give an opportunity to evaluate which services are most often requested by API), error logs and just records of changes in system (indicate "bottlenecks", if any).
The logging tool should collect logs from each system component and provide access to them in one place. If the system is not adapted for scaling, the quality of the log analysis will drop.
We initially used 1cloud for logging MS SQL. However, with the growing number of clients and services (for example, we recently placed equipment in the Minsk data center and added support for IPv6 ), we had geographically separated infrastructure components that did not have access to the database. And one of our main tasks was to preserve the possibility of analyzing logs from a single place.
As we have already noted, MS SQL was used to store logs in 1cloud, and log4net was used to write them. And it began to create for us certain difficulties. Due to geographically separated components, it became impossible to maintain network connectivity with the database and provide a single point for analysis.
At the same time, a large amount of logs and the inability to build indices for all the fields we need to search led to an unnecessary simplification of the log analysis - we had to abandon the functionality for the sake of performance.
To solve this problem and ensure scalability, we have implemented a new logging system. In total, we studied more than fifty different solutions and identified four that fully met our requirements:
These four solutions are: Fluentd, Graylog, Logalyse and Logstash.
The solution has 9.2 thousand stars on GitHub . Logstash is licensed under Apache 2.0 and is part of the ELK stack. It has a large number of plug-ins ( there are about 250 of them on GitHub ). Works under Windows and Linux and has high performance, almost independent of data volumes.
The system provides a quick overview and analysis of events from workstations, firewalls, routers and switches. This is due to the fact that there is no need to "normalize" events.
However, it should be understood that this is a “naked” engine, because it does not provide ready-made visualizations. Of the other drawbacks, we note the need to put Java on all servers, since Logstash is written in Ruby (JRuby).
The solution has a rather extensive community: there is an IRC channel and a separate forum . The network has examples on the configuration of the entire system and API . The following organizations use Logstash: CERN Control Center, GitHub, SoundCloud.
6.6 thousand stars on GitHub . Distributed under the Apache 2.0 license by CNCF (Cloud Native Computing Foundation) - it was founded by Google and The Linux Foundation to promote container technologies.
Fluentd runs on Linux, Windows and Mac and is written in Ruby (CRuby). Fluentd has a flexible plugin system that extends its functionality.
The solution has a unified logging format: the data Fluentd tries to bring to the JSON format. To ensure the reliability of the work, no third-party solutions are required, but this requires additional configuration. It is also not recommended to install it on servers that generate logs.
The community is large: there is a channel in Slack , as well as thread in Google Groups . On the official site of the project there are examples of configurations and API . Fluentd is used by companies such as Microsoft, Amazon, change.org and Nintendo.
4.3 thousand stars on GitHub . Distributed under the GNU GPL v3 license. It works only under Linux. Centralized plug-in ecosystem and customizable buffering system. For convenience, it allows for a keyword to combine incoming messages into streams and group these streams from different hosts.
The system uses Elasticsearch functions, but despite frequent Graylog updates and a developed community (there is a forum , an IRC channel , there are examples of configurations and APIs on the project’s official website ), it takes a long time to integrate current versions of Elasticsearch into a project. For example, last year there was a situation when Graylog 2.2.1 (at that time last)only worked with Elasticsearch version 2.4.4, which was considered obsolete.
In its work, Graylog uses the European Environment Agency, Dial Once, Stockopedia, and others.
Works under Linux and Windows. The system has high performance and is able to compile detailed reports on keywords. There is a serious drawback - LOGalyze collects logs in its file database, where it then indexes them, occupying a significant amount of disk space.
The developers of LOGalyze maintain their own blog , and the discussion of the solution takes place in Google groups . There is a guide to system configuration and data migration , as well as the CLI .
After evaluating these four options, we chose Logstash and decided to organize an ELK stack (ElasticSearch, Logstash, Kibana). Of these, Elasticsearch is a search engine, Logstash is a mechanism for collecting and analyzing logs, and Kibana is “engaged” in analytics and data visualization.
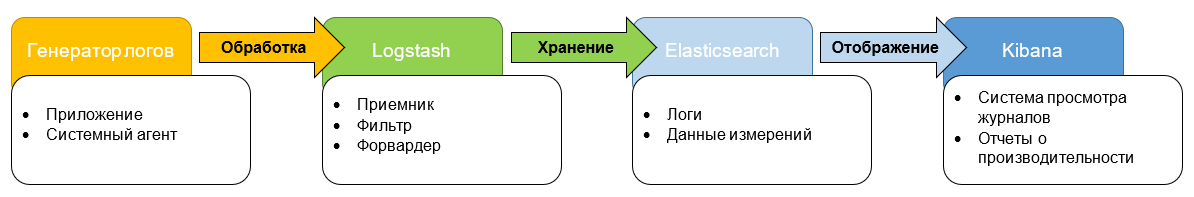
We chose ELK, since all three components are developed by one “manufacturer”, therefore they are well integrated with each other. If necessary, we can use each of these tools separately for other tasks.
This approach makes the product flexible and versatile. All this will allow for more efficient processing of already existing data volumes and faster implementation of new services - it will be easier to connect them.
The test environment is now ready. It "covers" all services, the logs of which we will analyze. We are completing the latest debugging processes and are planning a full launch of the solution in the near future.
By the way, despite the fact that we analyzed in detail the various options and chose the best for our needs, in the end, it was not without a fly in the ointment. When testing a solution, we encountered a situation where Kibana dropped Elasticsearch with a query - which is considered an extremely rare and degenerate case. Also, when “assembling” the system, a number of issues arose, mainly related to security. In the basic version, Elasticsearch is not protected by anything - it was necessary to adapt third-party software for these purposes.
After launch, we will set up monitoring systems to respond as quickly as possible to failures in the log service. We expect that the new technology stack will improve the user experience of our customers and further develop our services in the future.
Today we decided to share the experience of choosing a logging system and tell why in 1cloud we stopped at ELK.
/ Pixabay / picupyourphoto / PD
Moment of theory
When switching to production, applications turn into original “black boxes”. Their work must be constantly monitored to prevent and respond to potential emergencies, to catch "bottlenecks".
Logging systems are an indispensable tool, without which this process cannot be done. Conducting a detailed analysis of the data collected, you can identify the "intrusion" into the network, identify incorrectly configured equipment and take action promptly. Also, logging is a mandatory requirement when passing various kinds of certifications, such as PCI DSS.
To automate the logging process there are special frameworks: log4j, log4net, Retrace, Logback, Logstash and others - many of them. Their logging tools have separate development tools, for example, JDK -there is java.util.logging . Of course, the functionality of different logging tools is different, and the required set of functions must be chosen on the basis of business requirements. However, there are a number of common points that are worth noting when choosing a system for analyzing logs.
Ease of use and community size
Simplicity is one of the key components when choosing a logging system. All developers in the team work with log frameworks, so the experience of using this tool should be positive and not turn log analysis into a nightmare. The framework API must be intuitive, so that everyone who has not worked with the system before can quickly figure out how it is set up and configured.
If we consider the open source system of logging, then it makes sense to assess the community that has formed around it. To do this, you can study how often it is mentioned on specialized sites ( Stack Overflow ), as well as in profile threads, for example, on Reddit. As an option - to see the popularity of the project on GitHub (the number of stars) and see how often it is entered into various collections of tools in the network ( like these ). Obviously, the larger the community, the higher the likelihood that you will be helped in case of unforeseen difficulties.
As for the choice of proprietary logging systems, here, first of all, it is worth looking at the speed of responses and the adequacy of the support service of the chosen solution, as well as its price.
The possibility of collecting "variegated" logs
Not all logging platforms are able to process large amounts of data and provide complete information about the systems used.
Before choosing a solution, you should decide which logs you plan to collect: HTTP logs (they will help you understand the behavior of users on the site), API logs (will give an opportunity to evaluate which services are most often requested by API), error logs and just records of changes in system (indicate "bottlenecks", if any).
Scalability
The logging tool should collect logs from each system component and provide access to them in one place. If the system is not adapted for scaling, the quality of the log analysis will drop.
We initially used 1cloud for logging MS SQL. However, with the growing number of clients and services (for example, we recently placed equipment in the Minsk data center and added support for IPv6 ), we had geographically separated infrastructure components that did not have access to the database. And one of our main tasks was to preserve the possibility of analyzing logs from a single place.
1cloud logging system
As we have already noted, MS SQL was used to store logs in 1cloud, and log4net was used to write them. And it began to create for us certain difficulties. Due to geographically separated components, it became impossible to maintain network connectivity with the database and provide a single point for analysis.
At the same time, a large amount of logs and the inability to build indices for all the fields we need to search led to an unnecessary simplification of the log analysis - we had to abandon the functionality for the sake of performance.
To solve this problem and ensure scalability, we have implemented a new logging system. In total, we studied more than fifty different solutions and identified four that fully met our requirements:
- single log storage;
- horizontal scaling of the system if necessary;
- processing large amounts of data;
- powerful log analysis system.
These four solutions are: Fluentd, Graylog, Logalyse and Logstash.
Logstash
The solution has 9.2 thousand stars on GitHub . Logstash is licensed under Apache 2.0 and is part of the ELK stack. It has a large number of plug-ins ( there are about 250 of them on GitHub ). Works under Windows and Linux and has high performance, almost independent of data volumes.
The system provides a quick overview and analysis of events from workstations, firewalls, routers and switches. This is due to the fact that there is no need to "normalize" events.
However, it should be understood that this is a “naked” engine, because it does not provide ready-made visualizations. Of the other drawbacks, we note the need to put Java on all servers, since Logstash is written in Ruby (JRuby).
The solution has a rather extensive community: there is an IRC channel and a separate forum . The network has examples on the configuration of the entire system and API . The following organizations use Logstash: CERN Control Center, GitHub, SoundCloud.
Fluentd
6.6 thousand stars on GitHub . Distributed under the Apache 2.0 license by CNCF (Cloud Native Computing Foundation) - it was founded by Google and The Linux Foundation to promote container technologies.
Fluentd runs on Linux, Windows and Mac and is written in Ruby (CRuby). Fluentd has a flexible plugin system that extends its functionality.
The solution has a unified logging format: the data Fluentd tries to bring to the JSON format. To ensure the reliability of the work, no third-party solutions are required, but this requires additional configuration. It is also not recommended to install it on servers that generate logs.
The community is large: there is a channel in Slack , as well as thread in Google Groups . On the official site of the project there are examples of configurations and API . Fluentd is used by companies such as Microsoft, Amazon, change.org and Nintendo.
Graylog
4.3 thousand stars on GitHub . Distributed under the GNU GPL v3 license. It works only under Linux. Centralized plug-in ecosystem and customizable buffering system. For convenience, it allows for a keyword to combine incoming messages into streams and group these streams from different hosts.
The system uses Elasticsearch functions, but despite frequent Graylog updates and a developed community (there is a forum , an IRC channel , there are examples of configurations and APIs on the project’s official website ), it takes a long time to integrate current versions of Elasticsearch into a project. For example, last year there was a situation when Graylog 2.2.1 (at that time last)only worked with Elasticsearch version 2.4.4, which was considered obsolete.
In its work, Graylog uses the European Environment Agency, Dial Once, Stockopedia, and others.
LOGalyze
Works under Linux and Windows. The system has high performance and is able to compile detailed reports on keywords. There is a serious drawback - LOGalyze collects logs in its file database, where it then indexes them, occupying a significant amount of disk space.
The developers of LOGalyze maintain their own blog , and the discussion of the solution takes place in Google groups . There is a guide to system configuration and data migration , as well as the CLI .
After evaluating these four options, we chose Logstash and decided to organize an ELK stack (ElasticSearch, Logstash, Kibana). Of these, Elasticsearch is a search engine, Logstash is a mechanism for collecting and analyzing logs, and Kibana is “engaged” in analytics and data visualization.
We chose ELK, since all three components are developed by one “manufacturer”, therefore they are well integrated with each other. If necessary, we can use each of these tools separately for other tasks.
This approach makes the product flexible and versatile. All this will allow for more efficient processing of already existing data volumes and faster implementation of new services - it will be easier to connect them.
The test environment is now ready. It "covers" all services, the logs of which we will analyze. We are completing the latest debugging processes and are planning a full launch of the solution in the near future.
By the way, despite the fact that we analyzed in detail the various options and chose the best for our needs, in the end, it was not without a fly in the ointment. When testing a solution, we encountered a situation where Kibana dropped Elasticsearch with a query - which is considered an extremely rare and degenerate case. Also, when “assembling” the system, a number of issues arose, mainly related to security. In the basic version, Elasticsearch is not protected by anything - it was necessary to adapt third-party software for these purposes.
After launch, we will set up monitoring systems to respond as quickly as possible to failures in the log service. We expect that the new technology stack will improve the user experience of our customers and further develop our services in the future.