Productivity in iOS - Core Animation, Offscreen Rendering and System Trace. Part 2

How to avoid performance problems using the Core Animation preset, what to use for tracing code sections and using what functions to reduce the share of computational operations in the application from 26% to 0.6% - read in the second part of the article based on the report by Luke Parham at last year’s MBLT DEV conference . The first part of the article is available here .
Under the cut, not only useful tips, but also the latest early bird tickets for MBLT DEV 2018 - you can only buy them today.
Core Animation
Core Animation (CA) - a preset in the profiler that uses FPS measurements (frames per second) to see if animations are lagging or not. Often, even if problem areas of the application are found, performance problems remain. The reason is that when working with UI frameworks, UIView is used, but a CATransaction instance is created under the hood (or the system does it itself), and all these instructions are sent to the server for processing. The rendering server is responsible for creating the animation. If the animation is performed using a UIView, for example, a class method animate(withDuration:animations:), it is processed by the render server, which is considered a separate thread and works with all animations in the application.
You can make the render server work slowly so that it does not appear in the Time Profiler, but it will still slow down the application. Here's what it looks like:


At the top is the frame rate sensor. Below - the most important part - debugging options. There are two key and at the same time easy in setting parameter. The first is color blended layers. Fix it pretty easy. In fact, problems even arise in Apple's iMessage, everyone's favorite application.

Red color indicates areas with a white background. They are superimposed on another white background, and for some reason appear transparent. It turns out that the program mixes these colors with each other - white and white, and as a result, white is obtained again. As a result, for each pixel, which is marked in red, extra calculations are performed, which do not bring any benefit - you get a white background.
Rule # 3
Make the layers opaque whenever possible - provided they have the same color that overlaps each other. The layer has a property opacitythat must be set to one. Always check that the background color is set and it is opaque.

Offscreen rendering
The next parameter is off-screen rendering. If you enable this feature, the areas will be highlighted in yellow.
The convenience of Core Animation is the ability to view other applications. You can enable the settings, start the application and see what is going wrong. On the screen on Instagram at the top there are small yellow circles in which users' storys are shown.

For example, on iPhone 6s, they load quite slowly. And if you look at them on the iPhone 5 or on the old iPod, the download will go even slower. This is due to the fact that the in-system rendering is much worse than alpha blending. It loads the graphics processor. As a result, the device has to constantly perform additional calculations between the graphics processor and the central processor, so additional delays occur, which in most cases can be avoided.
Rule # 4
Do not use the parameter cornerRadius. Application viewLayer.cornerRadiusleads to offscreen rendering. Instead, you can use a class UIBezierPath, as well as something similar to working with CGBitMap, as was previously done with JPEG decoding. In this case is used UIGraphics context.
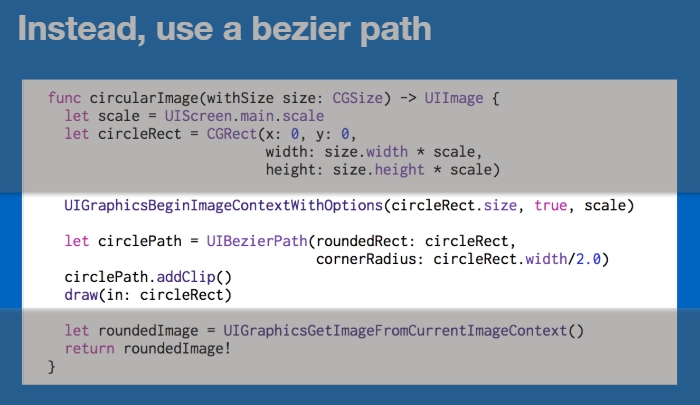
This is another instance method of the UIImage class. Here you can set the size and make rounded corners. Bezierpathused to highlight the image area. Then the fragment is returned from the UIImageContext. Thus, we get the finished image with rounded corners instead of rounding the frame into which the image will be inserted.
On gifke - Twitter page. The image is shown in real time. It is assumed that the page will open and display information, but the text and other elements of the screen passed through off-screen rendering, so the animations move very slowly.
Rule # 5
The class property shouldRasterizefrom the CALayer set allows you to cache textures that have been rendered. Better to avoid it. If a shouldRasterizecertain number of milliseconds has not been used, it will leave the cache and will offer rendering of each frame. So it creates more problems than good.
Speed up
- Avoid off-screen rendering and blending of transparent layers.
- Use them only when you can not do without them. Off-screen rendering appears due to the presence of shadows, rounding corners, and so on.
- Make the images opaque.
- Do not use cornerRadius, use Bezier curves.
- When working with text, do not use the layer.shadow property; replace with NSShadow.
Activity trace
Activity tracing is similar to what Time Profiler does, but on a smaller scale. She allows to consider flows and their interaction among themselves.
Rule # 6
Use System Trace to track the time period for specific events. You can think of a way to trace events or code sections and see how long they take in the actual operation of the application. System Trace gives information about what is happening in the system:
- “Sing Post” signals that something important is happening.
- Marks are single events that are worth watching, for example, the appearance of animation.
- By the event interval, you can track how long the decoding takes.

So, the program shows how the code interacts with the rest of the system.
On the screenshot - an example of creating a system trace template:
- 1 - image loading
- 2 - image decoding
- 3 - tilt animations.
You need to add a few options to understand what color it will turn out. As a rule, they are assigned numbers, for example 1 or 2, and they turn red or green, depending on the setting. On Objective-C, you need to register a command #importfor kdebug_signpost. In Swift, they are already available.

Then you need to call this function, prescribing kdebug_signpost, or kdebug_signpost_startand kdebug_signpost_end.
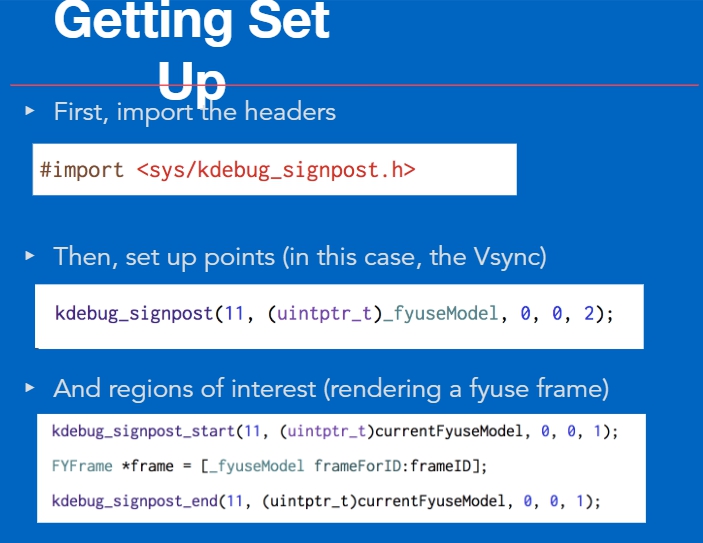
We specify 3 events together with the numbers that are written in the code, and the key element for each specific event. The last number indicates the color. For example, 2 is red.
Next come important events, special objects. A simplified scheme is described in Luke’s Swift test project .
On the screen you can see how it will look when you start the trace. At first, when the application is launched, the program will not give out information, but as soon as the application fails, we will see calculations.
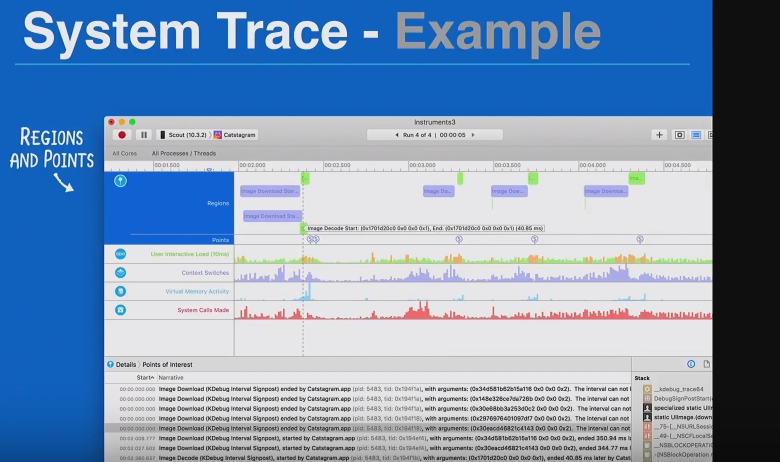
Image loading takes about 200 milliseconds. Then comes the decoding, which takes about 40 milliseconds. It is useful to keep track of this data if there are many operations in the application. You can list events in the program, and then observe and receive information about how long it takes to execute them, and how they interact with each other.
Additional tools
On the screen - AR-project for slow-motion smartphone. The app is like Snapchat. It uses the effect of photo retouching, and for each frame it spent 26.4% of all computational operations. Because of this, the camera was shooting slowly, about 10 frames per second. When studying we see that the topmost line performed the bulk of the work. She was responsible for actively sending data. If you investigate the causes of sinking performance, you will notice that it is a matter of heavy use NSDispatchData.
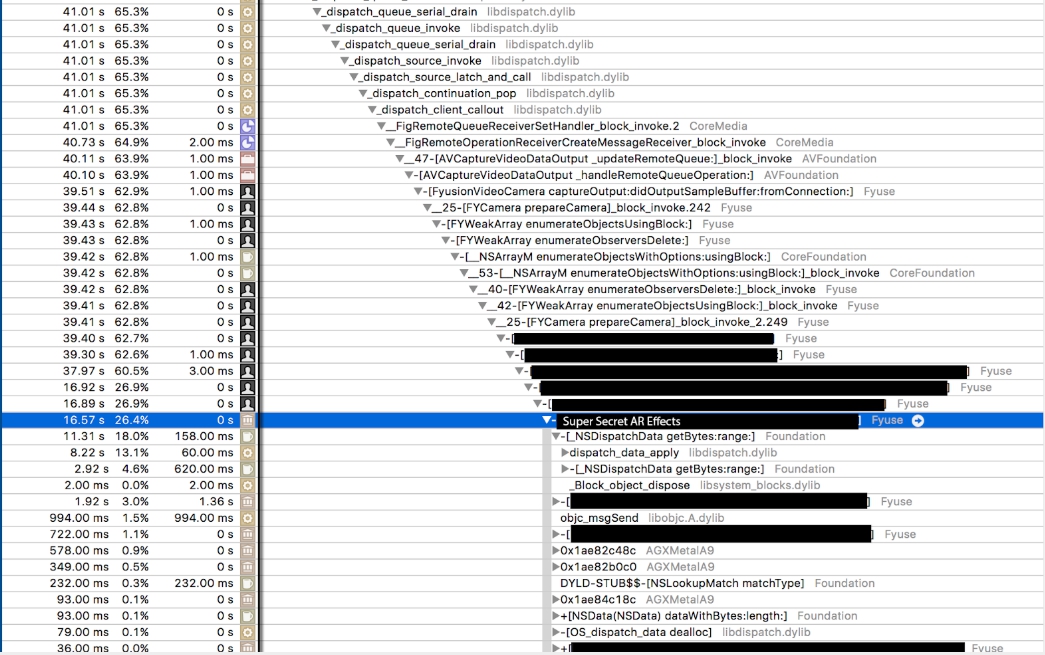
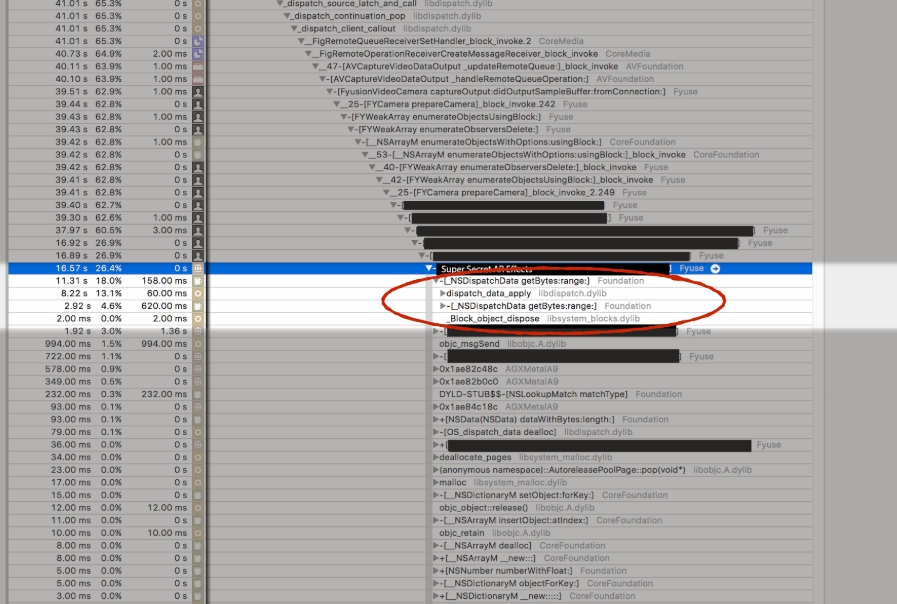
This subclass NSDataonly receives a sequence of bytes using a method getBytesin a certain interval and transfers it to another location. It seems that it is so simple, but everything that this method does inside takes 18% of 26% of the calculations.
Rule # 1
Use
NSDataand getBytes. This is a simple operation on Objective-C, but if it causes problems in the system, you should switch to a lower-level function to plain C. Since the problem is related to obtaining floating values, you can use the copy-memory function. With it, you can move a piece of data to another location. This greatly saves the computing power of the device. There are many operations in NSData. In the example, the source code is highlighted in red. Using the function,
getBytesyou can convert data into floating point numbers. The memory copying method is almost the same. It is fairly simple and performs an order of magnitude less operations.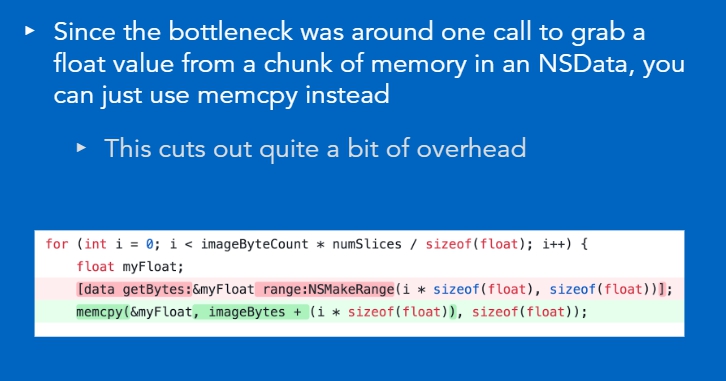
If you change the approach and run the application again, it is clear that the share of computational operations spent on changing the photo has decreased from 26% to 0.6%. And this is due to the change of only one line of copying memory code. The frame rate at the same time increased significantly.

Rule # 2
Avoid overlapping pixels when creating an application with rendering.
In most cases, this will occur with a frequency above 60 frames per second. By applying CADisplayLink, you can slow down the update UI. There is a parameter preferredFramesPerSecond. It applies only to iOS 10 and later. For older systems have to do it manually. When working in new versions of iOS, you can set the desired number of frames per second. In most cases - 15 frames per second or so, so as not to waste computing power in vain and not add extra work to the application.

Rule # 3
When working with Objective-C, it is useful to apply caching of IMP pointers (pointers to the implementation of methods). When a method
under the hoodis called in Objective-C , the function is called objc_msgSend(). If the trace shows that the call takes a long time, you can get rid of it. In essence, this is a cache repository with function pointers; they can be given the names of some methods. Therefore, instead of performing this search every time, you should do the caching as follows: put the function pointers in the cache and call them directly. This usually happens twice as fast.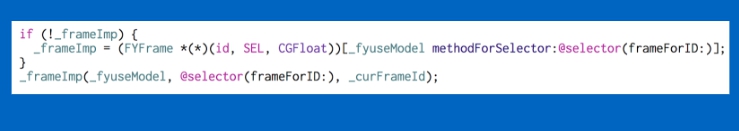
If there is no pointer, then the method is called using the methodForSelector command. To call this method using the usual call function, you must enter the name of the object in the selector, which gives the search results. Perhaps this is not the most convenient, but fast way.
Rule # 4
Do not use ARC (automatic reference counting). ARC adds a lot of extra work.
When the ARC is enabled, the compiler scatters retain/ releasein the right places. However, if there are places where retainit releasetakes too much time, take a look at the rejection of ARC. Do this if optimization is necessary, as it will take a lot of time.
Sometimes it is worth refusing even from Swift, especially if application performance is sensitive to changes. Swift has some really cool features, but it also requires you to write many lines of code to accomplish even small tasks in order to achieve a high level of functionality.
Useful materials
The first part of the article is available here . For further immersion in the topic, Luke Parham recommends reading the book “ iOS and MacOS: Performance Tuning ” and watch its tutorials .
Video of Luke's report on MBLT DEV 2017 is now publicly available:
More knowledge and tips on MBLT DEV 2018
First speakers announced:
- John C. Fox from Netflix will talk about high-quality localization, working with aggressive network conditions and A / B testing.
- Krzysztof Zabłocki, The New York Times, is preparing a report on patterns in iOS.
- Laura Morinigo, Google Developer Developer, will talk about the best Firebase practices.
The latest early bird tickets will fly away today.
