Statistics and monitoring of PHP scripts in real time. ClickHouse and Grafana go to help Pinba
- Tutorial
In this article, I’ll show you how to use pinba with clickhouse and grafana instead of pinba_engine and pinboard.
On a phba project, pinba is probably the only reliable way to understand what is happening with performance. True, pinba is usually implemented only when problems are already observed and it is not clear where to dig.
Often no one has a clue how many times per second / minute a particular script is called and begin to optimize "by touch", starting from those places that seem more logical.
Someone analyzes nginx logs, and someone slow requests in a DB.
Of course pinba would not be superfluous, but there are several reasons why it is not on every project. And the first reason is the installation.
In order to more or less get some kind of “exhaust” from the introduction of pinba, it is very desirable to see metrics not only in the last minutes, but also over a long period of time (from days to months).
To do this, you need:
Due to the small amount of information about pinba, many have the impression that it worked only on php5 and has long been in the past, but as we will see later, this is not so.
The first step is the easiest, all you need to do is run the command:
In the repositories this extension is right up to php 7.3 inclusive and you do not need to compile anything.
After executing the installation command, we immediately get an already working extension that collects and sends the metrics of each script (duration, memory, etc.) in the protobuf format by udp to 127.0.0.1 {0002 .
No one has yet caught and processed these udp packages, but it doesn’t affect the speed or stability of your php scripts.
Until recently, only pinba_engine was the only application that could catch and process these udp packets . Description " simple and concise"installation discourages the desire to ever read it again and delve into it. In kilometer-long dependency lists there are both package names and program names and links to individual pages with their installation, and those have their own links to other dependencies. Deal with this crap either who has neither the time nor the desire.
The process of installing pinba2 has not become much easier .
Perhaps someday pinba10 can be installed with one or two commands and not read a lot of material to understand how to do this, but so far this is not so.
If you still installed pinba_engine , then this is only half the story, because without a pinboardyou will have to restrict data only in the last few minutes or aggregate, save and visualize the data yourself. It's good that the pinboard is quite easy to install .
It would seem, why such suffering if all metrics from php already go to the udp port in protobuf format and all that is needed is to write an application that will catch and store them in some kind of storage? Apparently, those developers who came up with this idea immediately sat down to write their bikes, some of which fell on the github.
The following is a review of four open source projects that store metrics in storage, from which this data is easy to get and visualize, for example, using grafana.
udp server on go, which stores metrics in OpenTSDB. Perhaps if you already use OpenTSDB on the project, then such a solution will suit you otherwise I recommend passing by.
udp server on go, from the same habrayuzer which this time saves metrics in InfluxDB. On many projects, InfluxDB is already being used for monitoring, so this solution can be great for them.
Pros:
Minuses:
udp server on go that stores metrics in ClickHouse. This is my friend’s decision. It was after acquaintance with him that I decided that it was time to take on pinbu and clickhouse.
Pros:
Minuses:
udp server in php that stores metrics in ClickHouse. This is my solution resulting from my acquaintance with pinba, ClickHouse and protobuf. While I was dealing with this whole bunch, I wrote a “proof of concept”, which unexpectedly for me did not consume significant resources (30 MB of RAM and less than 1% of one of the eight processor cores), so I decided to share it with the public.
Pros are the same as in the previous solution, I also used the usual names from the original pinba_engine. I also added a config that allows you to run several pinbaserver instances at once to save metrics to different tables - this is useful if you want to collect data not only from php, but also from nginx.
Cons - a “fatal flaw” and those little things that you personally won’t be comfortable with, but my solution is “as simple as slippers” and consists of only about 100 lines of code, so any php developer can change what he doesn’t like in a couple of minutes.
How it works
udp port 30002 is listened. All incoming packets are decoded according to the protobuf scheme and are aggregated. Once a minute, the packet is inserted into the clickhouse in the pinba.requests table. (all parameters are configured in the config )
A little about the clickhouse
Clickhouse supports different data storage engines. The most commonly used is MergeTree.
If at some point you decide to store aggregated data for all the time, and raw data only for the last, then you can create a materialized view with a grouping, and clean the main table pinba.requests periodically, while all data will remain in the materialized view. Moreover, when creating the pinba.requests table, you can specify "engine = Null", then the raw data will not be saved to disk at all and at the same time it will still get into the materialized view and stored aggregated. I use this scheme for nginx metrics, because on nginx I have 50 times more requests than on php.
So, you have come a long way and I would not want to leave you halfway, so then there will be a detailed description of the installation and configuration of my solution and everything that you need, as well as pitfalls that more than one ship crashed on. The entire installation process is described for Ubuntu 18.04 LTS and Centos 7, on other distributions and versions the process may vary slightly.
I made all the necessary commands in the Dockerfile to facilitate the reproducibility of instructions. Only pitfalls will be described below.
php-pinba
After installation, make sure that in the /etc/php/7.2/fpm/conf.d/20-pinba.ini file you have all the options uncommented. In some distributions (for example, centos) they can be commented out.
clickhouse
During installation, clickhouse will ask you to set a password for the default user. By default, this user is available from all ip, so if you do not have a firewall on the server, be sure to set a password for it. This can also be done after installation in the /etc/clickhouse-server/users.xml file.
It is also worth noting that clickhouse uses several ports, including 9000. This port is also used for php-fpm in some distributions (for example, centos). If you already have this port in use, you can change it to another one in the /etc/clickhouse-server/config.xml file.
grafana with plugin for clickhouse
After installing grafana, use the username admin and the password admin. At the first entrance, the graphan will ask you to set a new password.
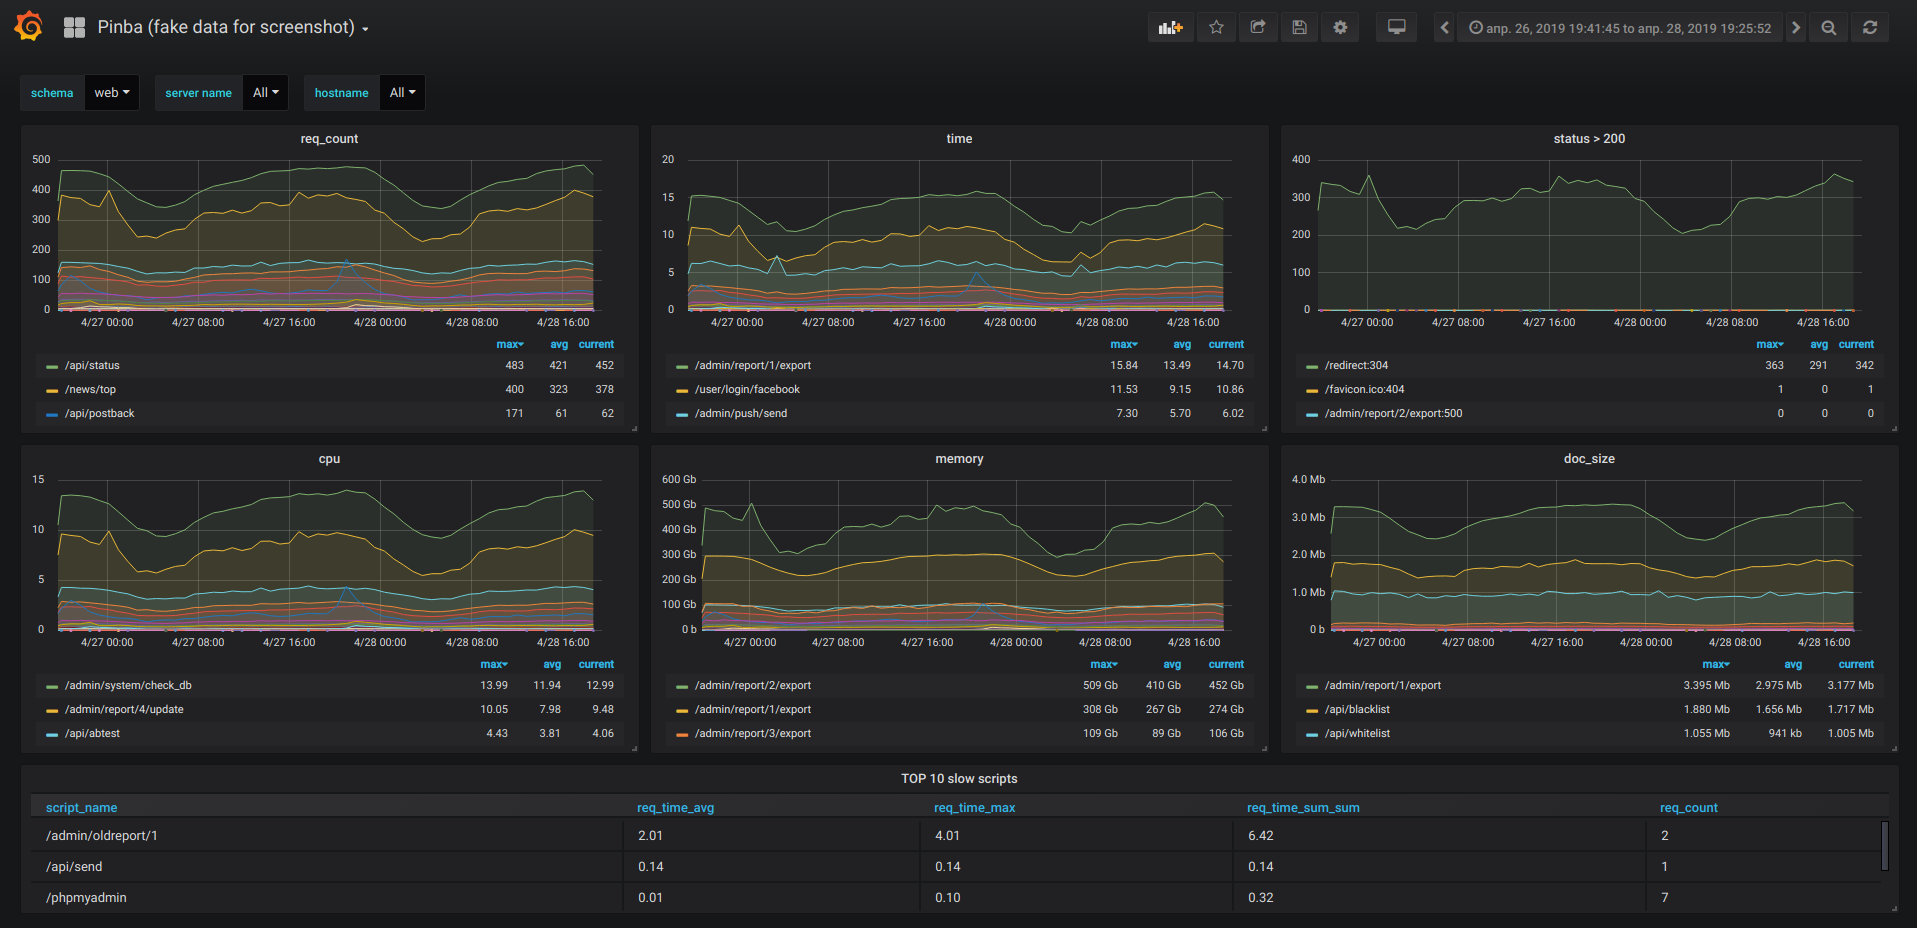
Next, go to the "+" -> import menu and specify the dashboard number for import 10011 . I prepared and filled this dashboard so that you would not have to do it yourself again.
The grafana supports working with the clickhouse through a third-party plug-in, but for third-party plug-ins, grafans do not have alerts (a ticket for this has been going on for several years).
pinba-server
Installing protobuf and libevent is optional, but improves pinba-server performance. If you install pinba-server in a folder other than / opt, then you will also need to fix the systemd script file.
pinba module under nginx
To compile the module, you need the sources of the same version of nginx that is already installed on your server, as well as the same compilation options, otherwise the assembly will succeed, but when the module is connected, an error will be generated that the module is binary incompatible. Compilation options can be viewed using the nginx -V
command Life hacks.
All my sites work only on https. The schema field becomes meaningless, so I use it to separate the web / console.
In scripts that are accessible from the web I use:
And in the console (for example, crown scripts):
In my dashboard in graphan there is a web / console switch for viewing statistics separately.
You can also transfer your tags to pinbu, for example:
That's all.
A big request to answer the polls under the article.
Traditionally, I warn that I do not advise and do not help through personal messages of Habr and social networks.
Start a ticket on github.
Also, please support the English version of this article on reddit with the likes .
On a phba project, pinba is probably the only reliable way to understand what is happening with performance. True, pinba is usually implemented only when problems are already observed and it is not clear where to dig.
Often no one has a clue how many times per second / minute a particular script is called and begin to optimize "by touch", starting from those places that seem more logical.
Someone analyzes nginx logs, and someone slow requests in a DB.
Of course pinba would not be superfluous, but there are several reasons why it is not on every project. And the first reason is the installation.
In order to more or less get some kind of “exhaust” from the introduction of pinba, it is very desirable to see metrics not only in the last minutes, but also over a long period of time (from days to months).
To do this, you need:
- install extension for php (and maybe you want a module for nginx)
- compile extension for mysql
- install pinboard and configure cron
Due to the small amount of information about pinba, many have the impression that it worked only on php5 and has long been in the past, but as we will see later, this is not so.
The first step is the easiest, all you need to do is run the command:
apt install php-pinbaIn the repositories this extension is right up to php 7.3 inclusive and you do not need to compile anything.
After executing the installation command, we immediately get an already working extension that collects and sends the metrics of each script (duration, memory, etc.) in the protobuf format by udp to 127.0.0.1 {0002 .
No one has yet caught and processed these udp packages, but it doesn’t affect the speed or stability of your php scripts.
Until recently, only pinba_engine was the only application that could catch and process these udp packets . Description " simple and concise"installation discourages the desire to ever read it again and delve into it. In kilometer-long dependency lists there are both package names and program names and links to individual pages with their installation, and those have their own links to other dependencies. Deal with this crap either who has neither the time nor the desire.
The process of installing pinba2 has not become much easier .
Perhaps someday pinba10 can be installed with one or two commands and not read a lot of material to understand how to do this, but so far this is not so.
If you still installed pinba_engine , then this is only half the story, because without a pinboardyou will have to restrict data only in the last few minutes or aggregate, save and visualize the data yourself. It's good that the pinboard is quite easy to install .
It would seem, why such suffering if all metrics from php already go to the udp port in protobuf format and all that is needed is to write an application that will catch and store them in some kind of storage? Apparently, those developers who came up with this idea immediately sat down to write their bikes, some of which fell on the github.
The following is a review of four open source projects that store metrics in storage, from which this data is easy to get and visualize, for example, using grafana.
olegfedoseev / pinba-server (november 2017)
udp server on go, which stores metrics in OpenTSDB. Perhaps if you already use OpenTSDB on the project, then such a solution will suit you otherwise I recommend passing by.
Olegfedoseev / pinba-influxdb (June 2018)
udp server on go, from the same habrayuzer which this time saves metrics in InfluxDB. On many projects, InfluxDB is already being used for monitoring, so this solution can be great for them.
Pros:
- InfluxDB allows you to aggregate the received metrics, and delete the original after a specified time.
Minuses:
- this solution does not save timer information.
- InfluxDB will save the page addresses as tags and if you have many unique page addresses, this will lead to increased memory consumption . From a certain moment, he " will begin to eat memory as if not in himself ." ( source )
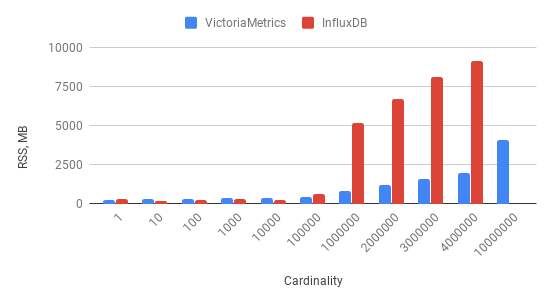
ClickHouse-Ninja / Proton (January 2019)
udp server on go that stores metrics in ClickHouse. This is my friend’s decision. It was after acquaintance with him that I decided that it was time to take on pinbu and clickhouse.
Pros:
- the clickhouse is ideal for such tasks, it allows you to compress data so much that you can store all raw data even without aggregations
- if required, you can easily aggregate the resulting metrics
- ready-made template for grafana
- saves timer information
Minuses:
fatal flaw- there is no config in which it would be possible to configure the name of the database and tables, the address and port of the server.
- when saving raw data, an auxiliary dictionary table is used to store page and domain addresses, which subsequently complicates queries
- other little things that flow from the first minus
pinba-server / pinba-server (April 2019)
udp server in php that stores metrics in ClickHouse. This is my solution resulting from my acquaintance with pinba, ClickHouse and protobuf. While I was dealing with this whole bunch, I wrote a “proof of concept”, which unexpectedly for me did not consume significant resources (30 MB of RAM and less than 1% of one of the eight processor cores), so I decided to share it with the public.
Pros are the same as in the previous solution, I also used the usual names from the original pinba_engine. I also added a config that allows you to run several pinbaserver instances at once to save metrics to different tables - this is useful if you want to collect data not only from php, but also from nginx.
Cons - a “fatal flaw” and those little things that you personally won’t be comfortable with, but my solution is “as simple as slippers” and consists of only about 100 lines of code, so any php developer can change what he doesn’t like in a couple of minutes.
How it works
udp port 30002 is listened. All incoming packets are decoded according to the protobuf scheme and are aggregated. Once a minute, the packet is inserted into the clickhouse in the pinba.requests table. (all parameters are configured in the config )
A little about the clickhouse
Clickhouse supports different data storage engines. The most commonly used is MergeTree.
If at some point you decide to store aggregated data for all the time, and raw data only for the last, then you can create a materialized view with a grouping, and clean the main table pinba.requests periodically, while all data will remain in the materialized view. Moreover, when creating the pinba.requests table, you can specify "engine = Null", then the raw data will not be saved to disk at all and at the same time it will still get into the materialized view and stored aggregated. I use this scheme for nginx metrics, because on nginx I have 50 times more requests than on php.
So, you have come a long way and I would not want to leave you halfway, so then there will be a detailed description of the installation and configuration of my solution and everything that you need, as well as pitfalls that more than one ship crashed on. The entire installation process is described for Ubuntu 18.04 LTS and Centos 7, on other distributions and versions the process may vary slightly.
Installation
I made all the necessary commands in the Dockerfile to facilitate the reproducibility of instructions. Only pitfalls will be described below.
php-pinba
After installation, make sure that in the /etc/php/7.2/fpm/conf.d/20-pinba.ini file you have all the options uncommented. In some distributions (for example, centos) they can be commented out.
extension=pinba.so
pinba.enabled=1
pinba.server=127.0.0.1:30002
clickhouse
During installation, clickhouse will ask you to set a password for the default user. By default, this user is available from all ip, so if you do not have a firewall on the server, be sure to set a password for it. This can also be done after installation in the /etc/clickhouse-server/users.xml file.
It is also worth noting that clickhouse uses several ports, including 9000. This port is also used for php-fpm in some distributions (for example, centos). If you already have this port in use, you can change it to another one in the /etc/clickhouse-server/config.xml file.
grafana with plugin for clickhouse
After installing grafana, use the username admin and the password admin. At the first entrance, the graphan will ask you to set a new password.
Next, go to the "+" -> import menu and specify the dashboard number for import 10011 . I prepared and filled this dashboard so that you would not have to do it yourself again.
The grafana supports working with the clickhouse through a third-party plug-in, but for third-party plug-ins, grafans do not have alerts (a ticket for this has been going on for several years).
pinba-server
Installing protobuf and libevent is optional, but improves pinba-server performance. If you install pinba-server in a folder other than / opt, then you will also need to fix the systemd script file.
pinba module under nginx
To compile the module, you need the sources of the same version of nginx that is already installed on your server, as well as the same compilation options, otherwise the assembly will succeed, but when the module is connected, an error will be generated that the module is binary incompatible. Compilation options can be viewed using the nginx -V
command Life hacks.
All my sites work only on https. The schema field becomes meaningless, so I use it to separate the web / console.
In scripts that are accessible from the web I use:
if (ini_get('pinba.enabled')) {
    pinba_schema_set('web');
}
And in the console (for example, crown scripts):
if (ini_get('pinba.enabled')) {
    pinba_schema_set('console');
}
In my dashboard in graphan there is a web / console switch for viewing statistics separately.
You can also transfer your tags to pinbu, for example:
pinba_tag_set('country', $countryCode);That's all.
A big request to answer the polls under the article.
Traditionally, I warn that I do not advise and do not help through personal messages of Habr and social networks.
Start a ticket on github.
Also, please support the English version of this article on reddit with the likes .
Only registered users can participate in the survey. Please come in.
What OS are you using on the server?
- 53.6% Ubuntu 119
- 35.1% CentOS 78
- 26.5% Debian 59
- 2.2% Gentoo 5
- 3.1% Red Hat 7
- 2.2% Fedora 5
- 0% OpenSUSE 0
- 0% SuSE 0
- 2.2% Unix 5
- 6.3% Windows 14
- 4.9% other 11
What version of php on the server are you using?
- 41.2% 7.3 87
- 51.1% 7.2 108
- 31.7% 7.1 67
- 12.7% 7.0 27
- 15.1% 5 32
- 1.4% other 3
Have you ever used pinba?
- 16.8% yes 33
- 37.2% no, but I would like 73
- 7.6% not and would not want 15
- 38.2% no and have not heard about her 75
What version of pinba server would you like to try?
- 11.1% pinba_engine (mysql engine) 10
- 13.3% pinba2 (mysql engine) 12
- 17.7% pinboard (php + mysql) 16
- 1.1% olegfedoseev / pinba-server (go + OpenTSDB) 1
- 7.7% olegfedoseev / pinba-influxdb (go + influxdb) 7
- 28.8% ClickHouse-Ninja / Proton (go + clickhouse) 26
- 45.5% pinba-server / pinba-server (php + clickhouse) 41
- 5.5% I will write my own 5
- 22.2% other 20