Splunk through the eyes of a newbie: how we made a vault inventory system

Recently, the customer asked us to implement a disk capacity accounting system. The task was to combine information from more than seventy disk arrays of different vendors, from SAN switches and ESX-hosts of VMware. Then the data needed to be systematized, analyzed, and able to be displayed on dashboards and various reports, for example, on the free and occupied disk space in all or separately taken arrays.
We decided to implement the project using the operational performance analysis system - Splunk.
Why Splunk?
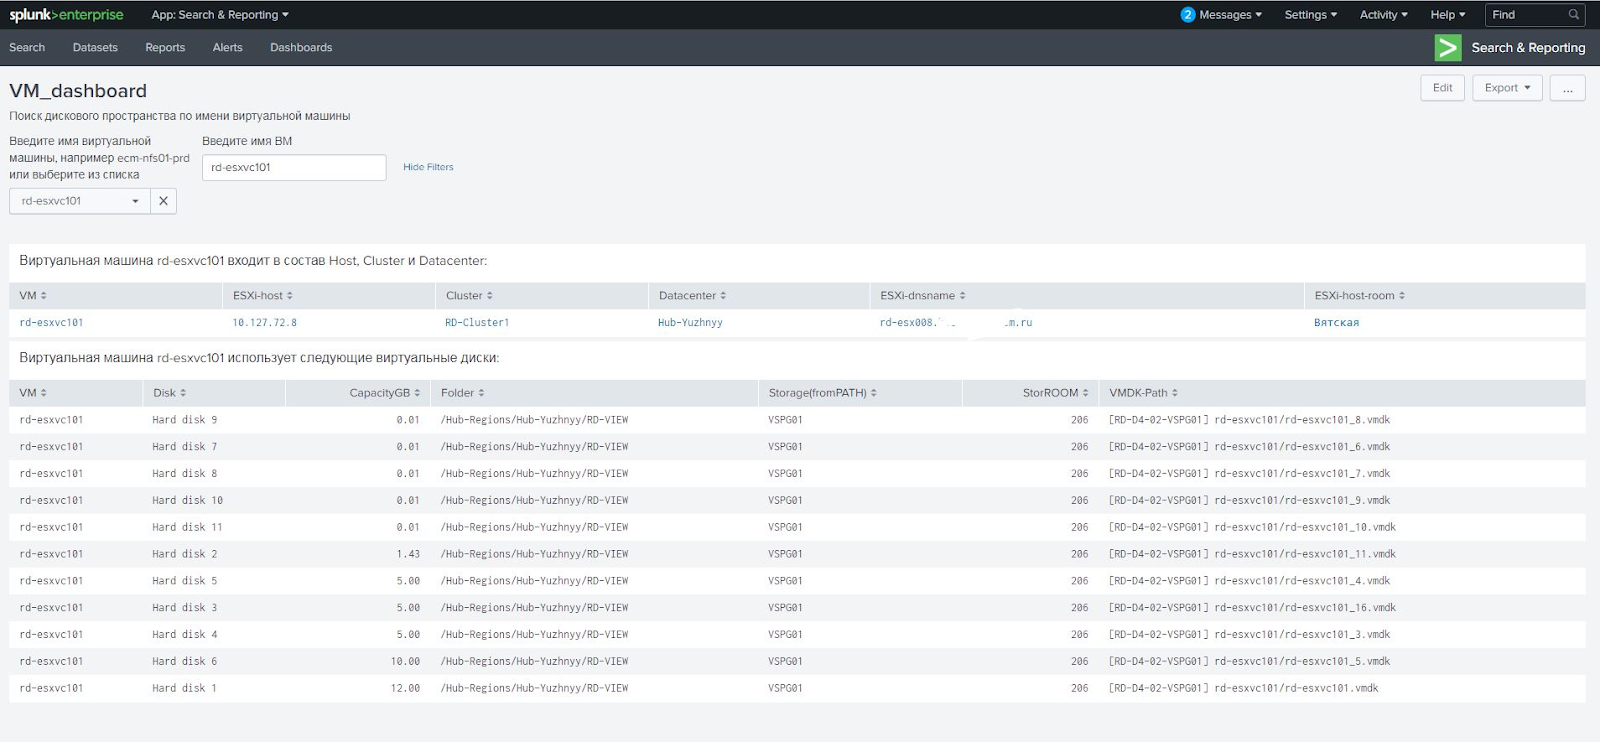
Splunk is powerful in its visualization of the collected data. It allows you to create interactive reports - dashboards, - updated in real time. On them, we derived information about the total disk space, displayed all the arrays at once with the ability to sort by different filters, for example, by capacity. Clicking on the array, we immediately get information about all connections. In a separate panel, you can enter the name of the virtual machine and see which ESX host it lives on, from which arrays it receives data and other parameters.
In my opinion, so far Splunk has no analogues that work out of the box with any storage systems. A few years ago, a paid CommandCentral appeared, but it does not have the necessary flexibility, it is not able to generate arbitrary reports (in the first versions of the reports there were no reports at all) and with lame visualization. In general, this tool is not for inventory, but for monitoring and controlling the status of systems. In order to accomplish the task set by the customer, it would have to be long and expensive to refine.
At the same time, Splunk has impressive display options: you can freely link graphics to each other, track the status of all systems in a single window, and thus simplify their maintenance. Everything else - for our task, we used the free version.

What they were doing?
Up to this point, our team had no experience with Splunk. Fortunately, the system was friendly and intuitive, and solutions to emerging problems were easily found with the help of regular help or search engine.
Splunk has a number of tools we need. For example, the system allows you to combine data from different sources for any field through the so-called Lookup'y (directories). So, in one table, ESX hosts were displayed as IP, in the other - as DNS names. At first we wanted to create a homemade Lookup and use the nslookup utility to select DNS records and collect the tables, but it turned out that Splunk has a directory that itself maps DNS over IP and vice versa. This built-in Lookup does not have to be configured, it itself extracts data about DNS servers from system settings, and it doesn’t matter whether it is Windows or Linux, and data about DNS records are always up to date.

One of the interesting scenarios implemented using Splunk is change control (RFC) in the system. For example, an RFC manager receives a service request from one of the SAN switches from an engineer. He enters the name of the switch into Splunk and sees which storages are connected to it and which servers receive data from these storages. At the same time, the manager sees the work plan that the engineer wrote, and can assess how disabling this switch during maintenance will affect the performance of the arrays and servers.
We set up a daily download to Splunk for information on connecting all switches and arrays. The customer is satisfied with this refresh rate. He already had a monitoring tool Stor2RRD, but he is not able to combine data from different sources and visualize them. Therefore, we set up the Splunk data collection system as follows:
- We receive from Stor2RRD information on storages;
- From switches we get information on SAN;
- Through vCenter, we collect data from ESX hosts using PowerCLI scripts.
The received data is automatically brought into a single form, processed and displayed in the form of any necessary reports.
What had to fight?
Splunk is a powerful system, but there are tasks that cannot be solved out of the box, and for solving some problems deep knowledge of VMware is needed.
For example, a customer uses for virtual machines and RDM disks allocated directly, and ordinary virtual datastores. These two types of disks need to work differently. First, we solved the problem on our own, but then we faced a situation where the virtual machine received both RAW disks and virtual disks. It turned out that we received the wrong Path field in the report from vCenter and the wrong link to the disk array of the RAW disk. The circuit works with regular datastores, but does not work with RAW disks. For them, you need to use the property of the disk RAW Disk ID, which contains the sign of the disk. I had to contact VMware specialists, who redesigned the script so that it calculates the correct array using the RAW Disk ID.
We also didn’t immediately learn how to work optimally with PowerCLI scripts, later on we had to refine the algorithms. Initially, scripts processed data from several thousand virtual machines for as long as three hours! After completion, the duration of the scripts has been reduced to forty minutes.
What is the result?
Having no experience with Splunk, we quickly implemented a disk capacity accounting system based on it, which receives information from numerous sources, consolidates it and provides a wide range of convenient and visual graphs. If you have never had to choose or create such a system, then Splunk is a good candidate for this role. It works quickly, easily and flexibly configured and does not require any specialized knowledge to solve the vast majority of tasks.
Vladislav Semenov, Head of Systems Architecture Group, Jet Info Systems Design Center