Another reason why Docker containers are slow
- Transfer
In the last post I talked about Kubernetes, about how ThoughtSpot uses it for its own needs to support development. Today I would like to continue the conversation about a short but not less interesting debugging story that happened just recently. The article is based on the fact that containerization! = Virtualization. In addition, it clearly shows how containerized processes compete for resources, even with optimal cgroup restrictions and high machine performance.
Previously, we launched a series of operations related to the development of b CI / CD in the internal cluster Kubernetes. Everything would be fine, but when you launch a “docked” application, performance unexpectedly dropped dramatically. We did not stint: in each of the containers there were restrictions on computing power and memory (5 CPU / 30 GB RAM), set through the configuration of Pod. On a virtual machine with these parameters, all our requests from a tiny data set (10 KB) for tests would fly. However, in Docker & Kubernetes with 72 CPU / 512 GB RAM, we managed to run 3-4 copies of the product, and then the brakes started. Requests that previously ended in a couple of milliseconds now hung 1-2 seconds, and this caused all sorts of failures in the CI task pipeline. I had to close debugging.
As a rule, under suspicion - all sorts of configuration errors when packaging the application in Docker. However, we did not find anything that could cause at least some slowdown (if compared with installations on bare hardware or virtual machines). It looks all right. Next, we tried all sorts of tests from the Sysbench package .. We checked the performance of the CPU, disk, memory - everything was the same as on bare hardware. Some services of our product store detailed information about all actions: it can then be used in performance profiling. As a rule, when there is a shortage of any resource (CPU, RAM, disk, network), some calls experience a significant time failure - this is how we find out what is slowing down and where. However, in this case nothing happened. The time proportions did not differ from the correct configuration - with the only difference that each call was much slower than on bare metal. Nothing pointed to the real source of the problem. We were ready to surrender, when we suddenly found this .
In this article, the author analyzes a similar mysterious case, when two, in theory, light processes killed each other when running inside the Docker on the same machine, and the resource limits were set at very modest values. We made two important conclusions:
- The main reason lay in the very core of Linux. Because of the structure of the dentry cache objects in the kernel, the behavior of one process strongly inhibited the kernel call
__d_lookup_loop, which directly affected the performance of another. - The author used
perfto detect errors in the kernel. Excellent debugging tool that we have never used before (which is a pity!).
perf (sometimes called perf_events or perf-tools; formerly known as Performance Counters for Linux, PCL) is a Linux performance analysis tool, available from kernel version 2.6.31. The user space management utility, perf, is available from the command line and is a set of subcommands.
It performs statistical profiling of the whole system (kernel and user space). This tool supports performance counters for hardware and software (for example, hrtimer) platforms, trace points, and dynamic samples (say, kprobes or uprobes). In 2012, two IBM engineers recognized perf (along with OProfile) as one of the two most used tools for profiling performance counters in Linux.
So we thought: maybe we have the same thing? We ran hundreds of different processes in containers, and all had the same core. We sensed that we attacked the trail! Armed perf, we repeated the debugging, and in the end we were waiting for the most interesting discovery.
Below are the records of the perffirst 10 seconds of ThoughtSpot, working on a healthy (fast) car (left) and inside the container (right).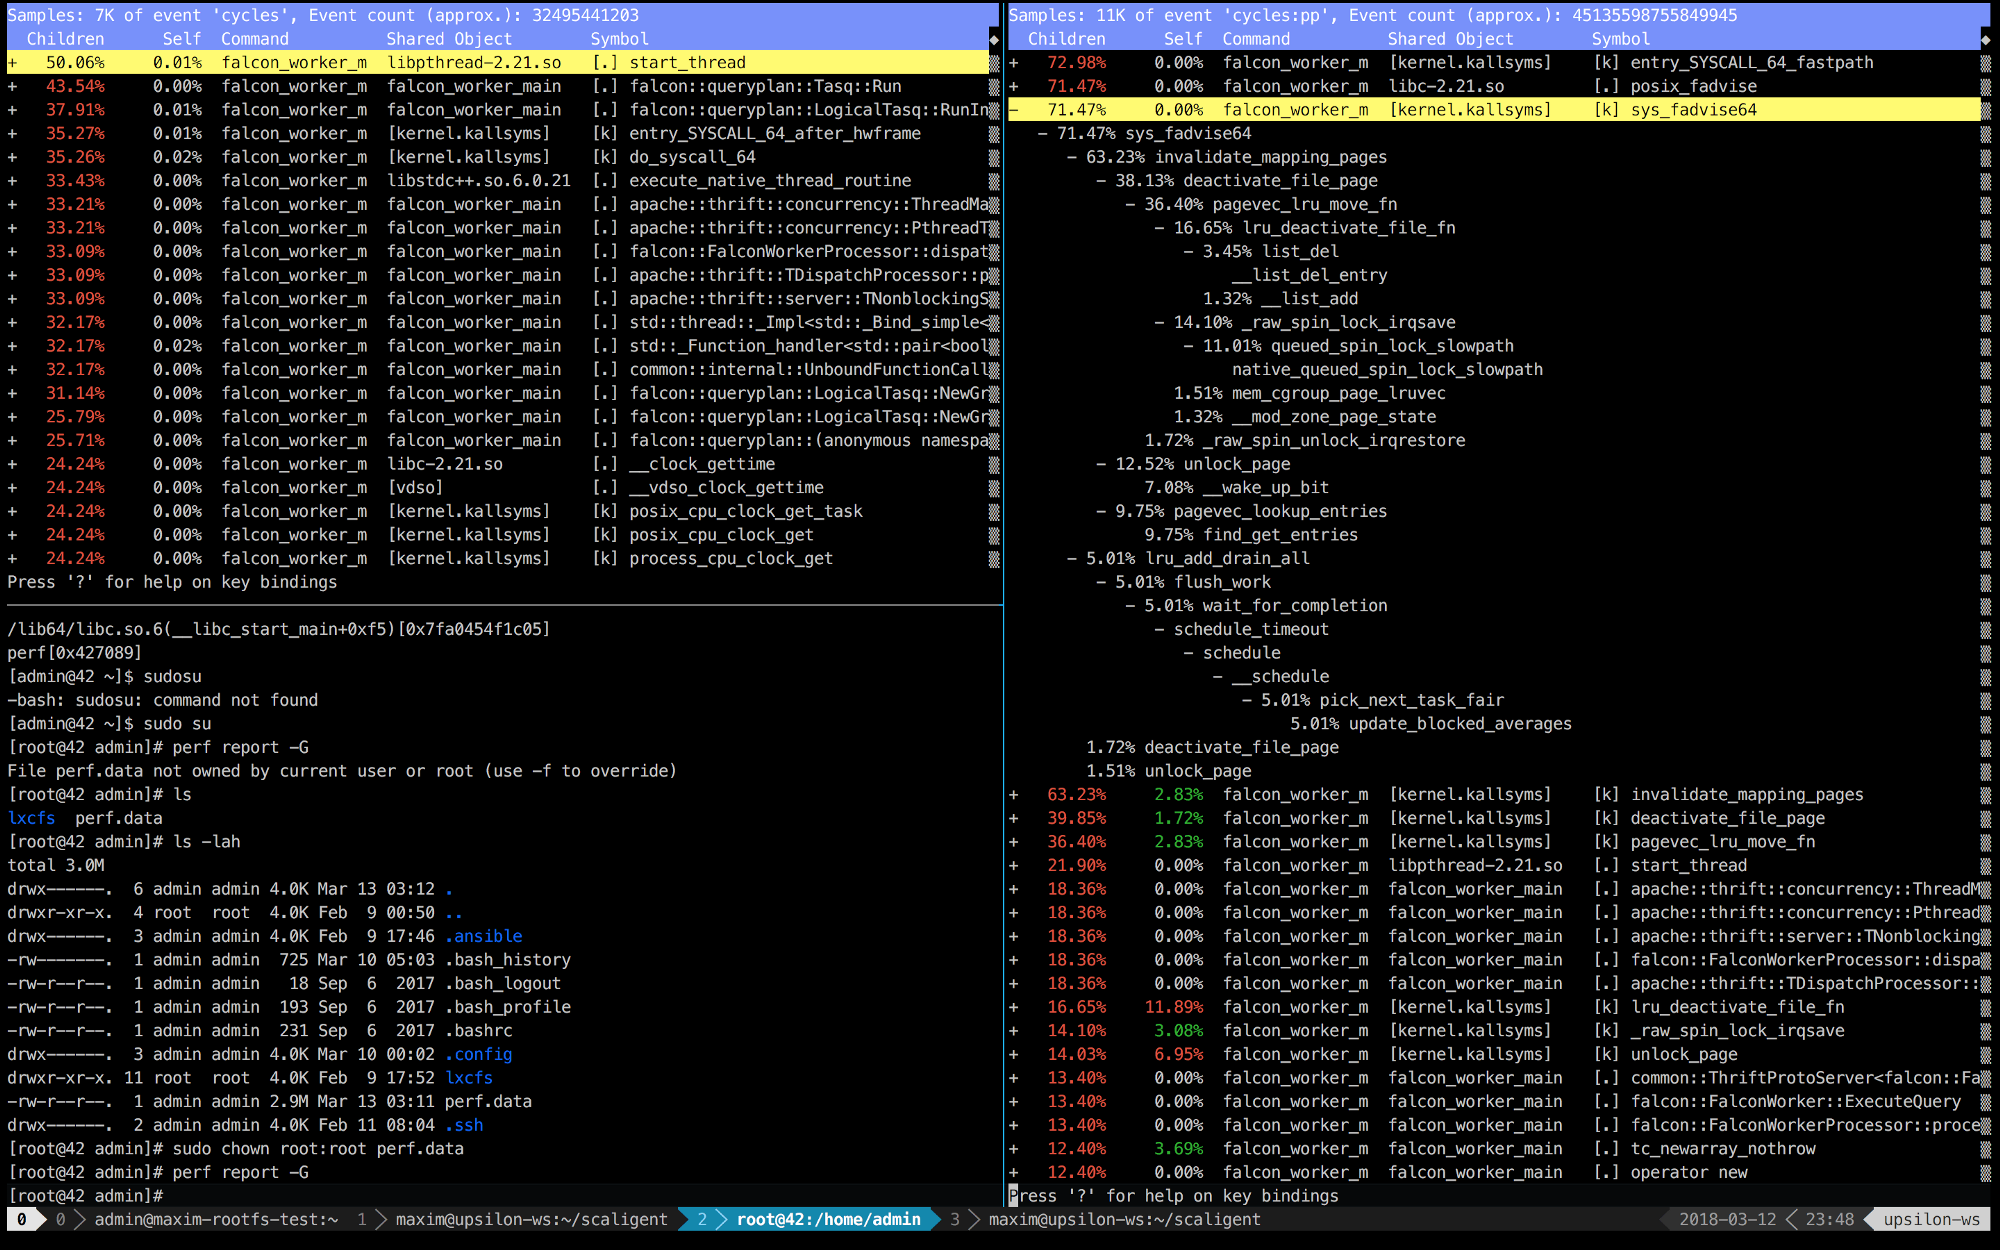
We immediately see that on the right the first 5 calls are connected with the core. Time is mainly spent on kernel space, while on the left - most of the time is spent on its own processes running in user space. But the most interesting thing is that the call takes all the time posix_fadvise.
Programs use posix_fadvise (), declaring their intention to access file data using a specific pattern in the future. This gives the kernel the opportunity to perform the necessary optimization.
The call is used for any situations, therefore it does not explicitly indicate the source of the problem. However, after digging into the code, I found only one place, which, theoretically, affected every process in the system:
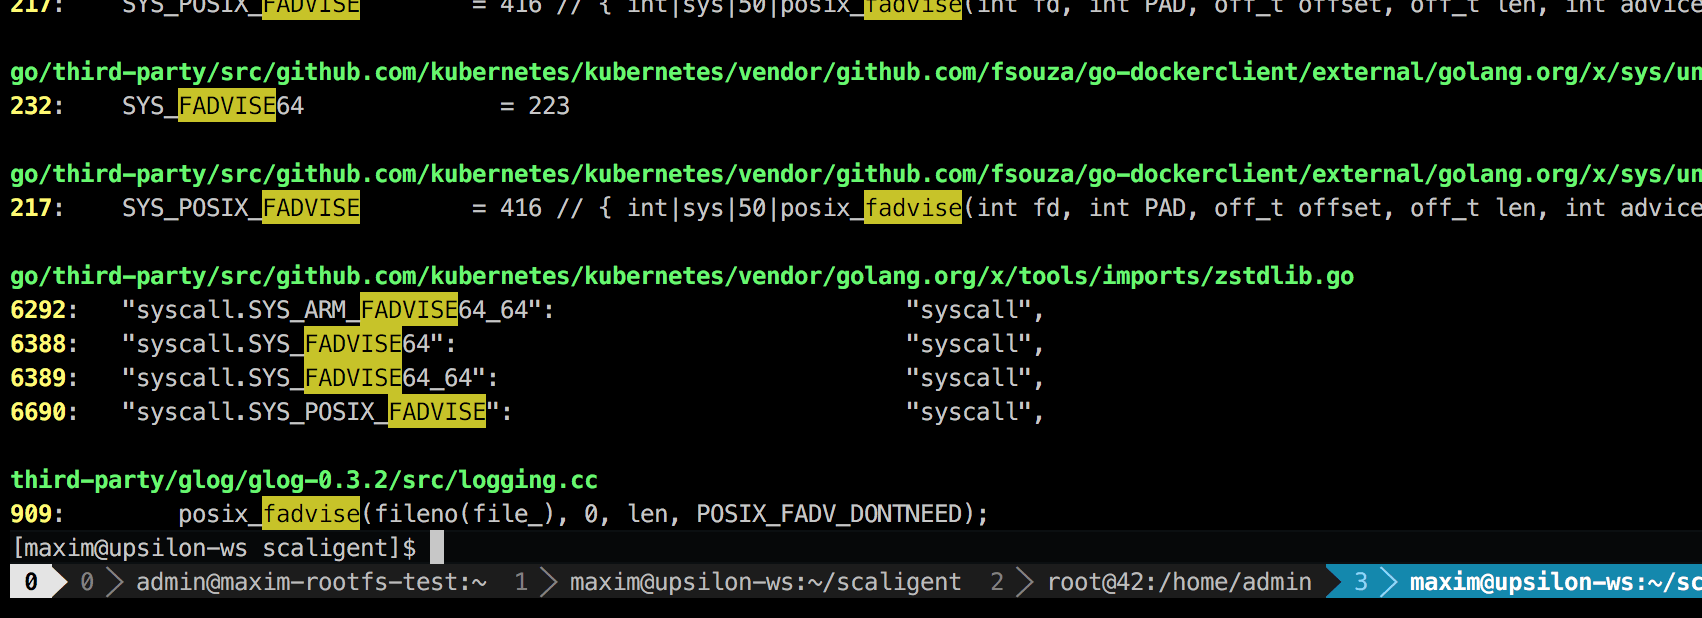
This is a third-party logging library called glog. We used it for the project. Specifically, this line (c LogFileObject::Write) is probably the most critical path of the entire library. It is called for all events “log to file” (log to file), and many instances of our product write the log quite often. A quick glance at the source code suggests that the fadvise part can be turned off by setting the parameter --drop_log_memory=false:
if (file_length_ >= logging::kPageSize) {
   // don’t evict the most recent pageuint32len = file_length_ & ~(logging::kPageSize — 1);
   posix_fadvise(fileno(file_), 0, len, POSIX_FADV_DONTNEED);
 }
}
which we, of course, did and ... on the bullseye!
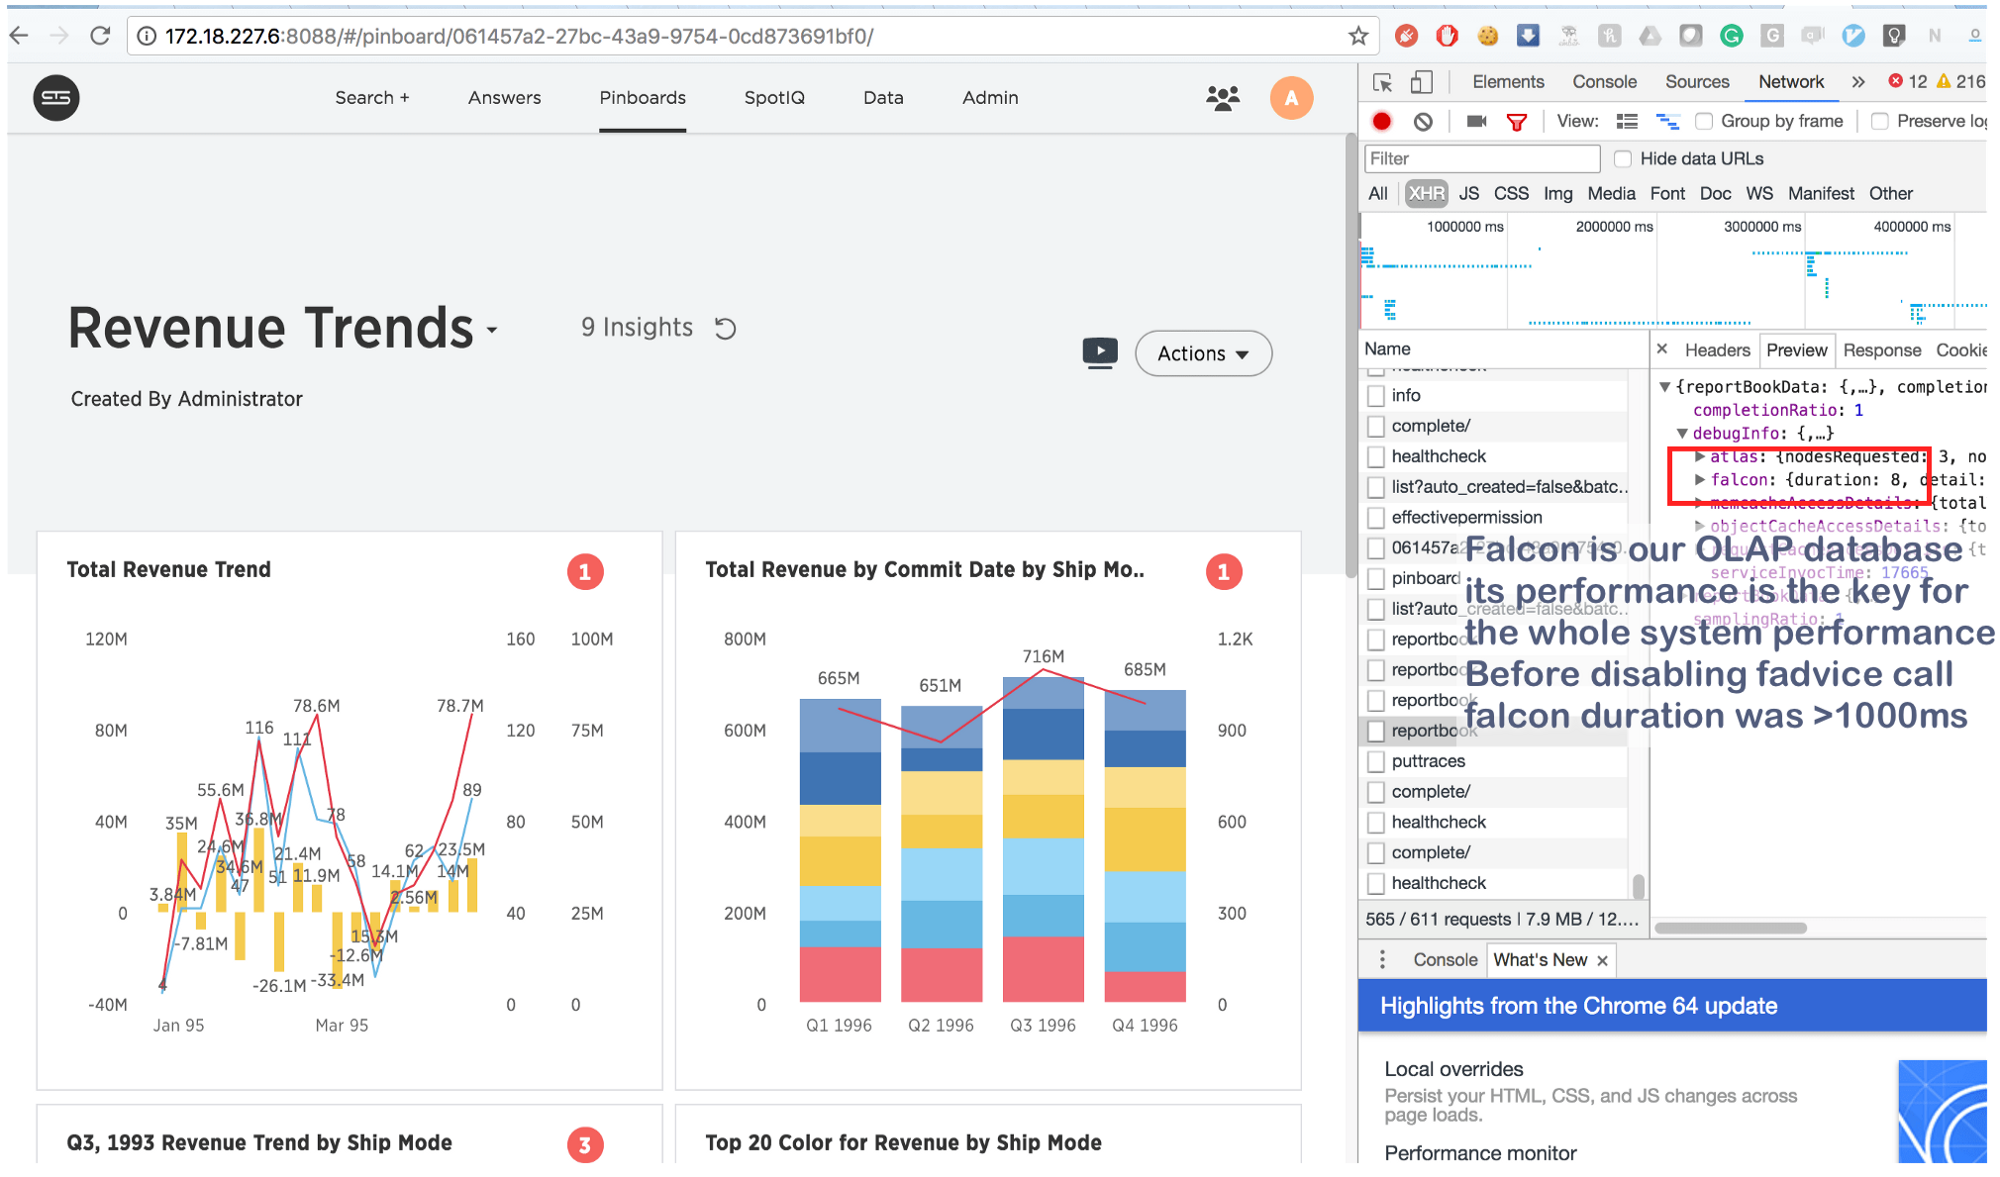
The fact that it used to take a couple seconds is now executed in 8 (eight!) Milliseconds. Googling a little bit, we found this: https://issues.apache.org/jira/browse/MESOS-920 and yet this: https://github.com/google/glog/pull/145 , which once again confirmed our hunch about the true cause of inhibition. Most likely, the same thing happened on the virtual machine / bare hardware, but since we had 1 copy of the process for each machine / core, the intensity of the fadvise call was significantly lower, which explained the lack of additional resource consumption. Increasing the logging process by 3-4 times and highlighting one common core, we saw that this really stopped fadvise.
In conclusion:
This information is not new, but for some reason many people forget the main thing: in cases with containers, “isolated” processes compete for all core resources , and not just for CPU , RAM , disk space, and the network . And since the kernel is an extremely complex structure, failures can occur anywhere (as, for example, in __d_lookup_loopthe article Sysdig). This, however, does not mean that containers are worse or better than traditional virtualization. They are a great tool for solving their problems. Just remember: the kernel is a shared resource, and get ready to debug unexpected conflicts in the kernel space. In addition, such conflicts are a great opportunity for attackers to break through the "thinned" isolation and create hidden channels between containers. And finally, there perfis an excellent tool that will show what is happening in the system and help debug any performance problems. If you plan to run high-load applications in Docker, then be sure to take the time to learn perf.