Automatic Java code quality check (iteration 1)

I plan this series of articles as a story in several parts on how to automatically check the quality of code in our project. This process, seemingly simple, turned out to be full of non-obvious details, so there was a desire to clarify the impending difficulties and their solutions to a wide audience, so that everyone could make their code a little better, bypassing the rake more.
As a result, I want to make sure that inspections, style checking, and metrics calculation are chased on the build server, then everyone will understand what the project is in. Moreover, ideally, all those checks that work on the server should also work in the IDE, so that comments on your code can be eliminated before the entire team finds out about them. As approaches improve, iterations will be added and published.
In this iteration, I will set up inspection inspection. We as a team are using IntelliJ IDEA and TeamCity company JetBrains , so you can use the funds that they provide. To begin with, IntelliJ IDEA will set up an inspection profile, the code compliance to which will be checked during each assembly using TeamCity. This is a regular method and is described in the official knowledge base on TeamCity , but not everything turned out very smoothly ...
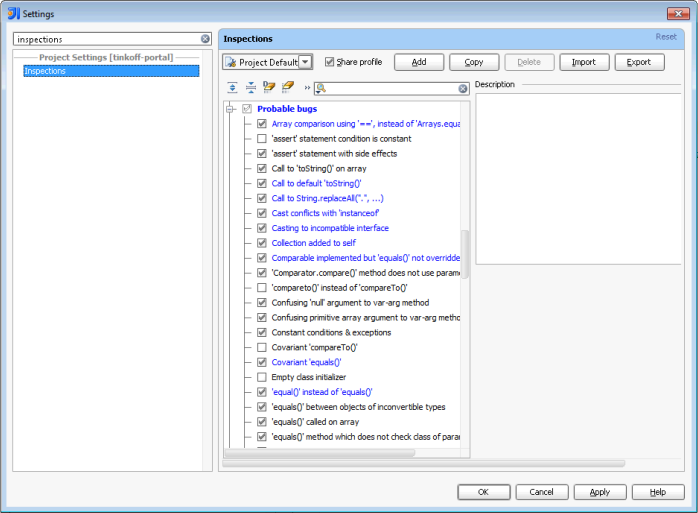
First you need to decide what to check, to do this, launch IntelliJ IDEA, open the project and find the settings. Now let's move to the Inspections section, for which it’s convenient to use the search. As a result, you will see such a picture - a complete list of inspections, divided into groups (in blue, inspections whose settings differ from the standard ones are highlighted):

There is a great field for creativity: each inspection can be compared with the seriousness with which it will be evaluated. Simply including all inspections will not force you to write code perfectly without turning on the brain. Inspections will only let you smell bad before. So there are absolutely opposite inspections, for example, “Constant on the left side of comparison” and “Constant on the right side of comparison”. The choice here depends on your preferences and on the standards that you are going to maintain. There are really a lot of inspections, a full passage will take several hours, so do not forget to stock up on good tea.
From useful noteworthy inspections:
- I / O resource opened but not safely closed - allows you to check that close is opened for all open resources and, moreover, in the right place (similar to JDBC, JNDI and nio);
- Missing Override annotation - I made a hard decision to be treated as an error, because it is fraught with these very errors (it is not for nothing that Scala uses the required keyword for such a declaration);
- Iteration over 'keySet ()' may be replaced with 'entrySet ()' iteration - oddly enough, few people think that the second way is faster and even exists;
- Chain of 'instanceof' checks - allows you to hint the malicious LSP violators that you can live
differently ; - Overly long method , Class with too many methods - allow you to ensure that methods and classes are broken in time and placed on a reasonable number of screens.
You can import the saved profile to other team members through the Import option so that the checks work the same way for the whole team. True, each time you change the profile, the team will have to do the import again, since changes to the exported file are not automatically tracked.
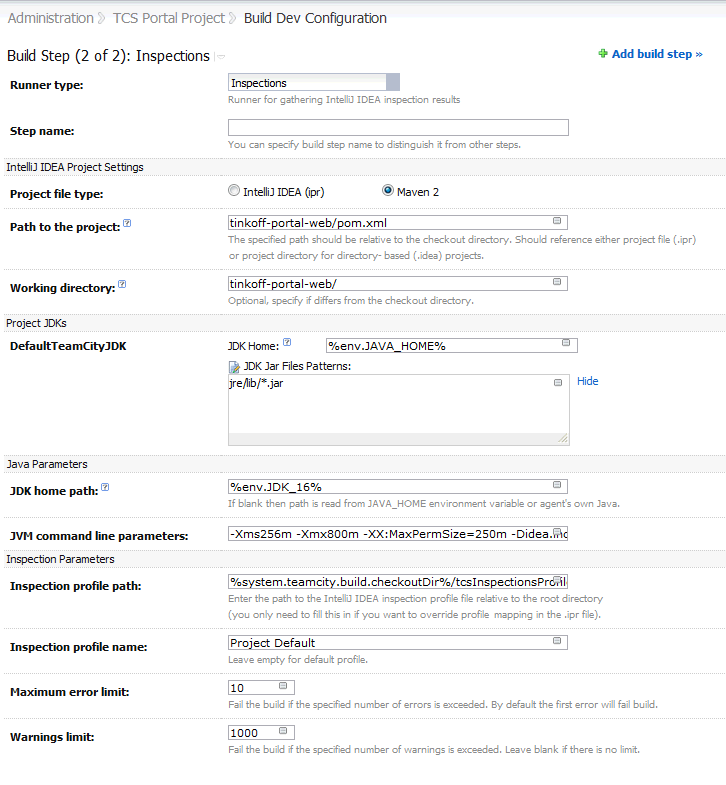
So, we moved on to setting up TeamCity. TeamCity allows you to build a project in a large number of different ways. For different methods, so-called Runners: Maven, Ant and about a dozen more. Among them there is a special - Inspections Runner. In order to use it, you need to create a separate assembly configuration (Configuration) or add a step (Build step) to the existing one. The figure below shows the completed form for this step:

We have a
Another interesting point: memory consumption. Without increasing the standard maximum allocated memory size and Permanent Generation size, inspection inspections will fall. In new versions of TeamCity, for example, in the 6.5.6 installed in our system, the JVM command line parameters field contains the following pre-written:
-Xmx512m -XX:MaxPermSize=150mIn the same field, you can make TeamCity check or not check certain packages , for example, it’s not very interesting to see what claims there are to stubs generated for working with
-Didea.include.patterns=src/main/java/ru/tcsbank/portal/*The next item is the path to our
%system.teamcity.build.checkoutDir%/tcsInspectionsProfile.xmlNow it remains only to indicate the name of the profile that we set when saving to IDEA and the number of warnings and errors that we consider fatal - in which case, the project stops collecting.
Initially, I took a number slightly larger than the total number of failed checks, then, as the quality of the code improved, this number decreased and continues to decrease.
So, we start our assembly and see

Well, now we always know if the commit has improved the quality of the code or worsened.
In conclusion, I want to say that TeamCity is more likely to build IntelliJ IDEA projects than Maven, it has a number of limitations: code styles are not checked, in addition to Maven, an IDEA instance is loaded on the server (during assembly, the line “Starting up IntelliJ IDEA 10.5.2 ... ") And more ... Inspection Runner behaves strangely on certain types of inspections, for example, there was a case when" Unused import "considered an unused class that was used to create an anonymous inheritor. Unfortunately, such inspections had to be turned off in order not to compromise the validation.
The subsequent selection of inspections can be carried out together with the team using the
In the next iteration, I plan to try using the "IntelliJ IDEA Project" runner, there is hope that this will allow the assembly to go faster and fix problems with the accuracy of inspections and will allow to abandon the constant reimport'ov inspection profile.
