Background: Kepler Space Observatory - iron, communication with the Earth, software and work results

At the end of October, the Kepler telescope, which NASA launched in March 2009, stopped working. Out of fuel, without it, the device cannot work - there is no possibility of positioning in space, and this is necessary for observing space. On the achievements of "Kepler" talked a lot on Habré, so I really try not to repeat (well, maybe a little bit). Instead, I will describe what the space observatory was in terms of technology and what software the Kepler team used to use, including for processing incoming data.
What was this telescope
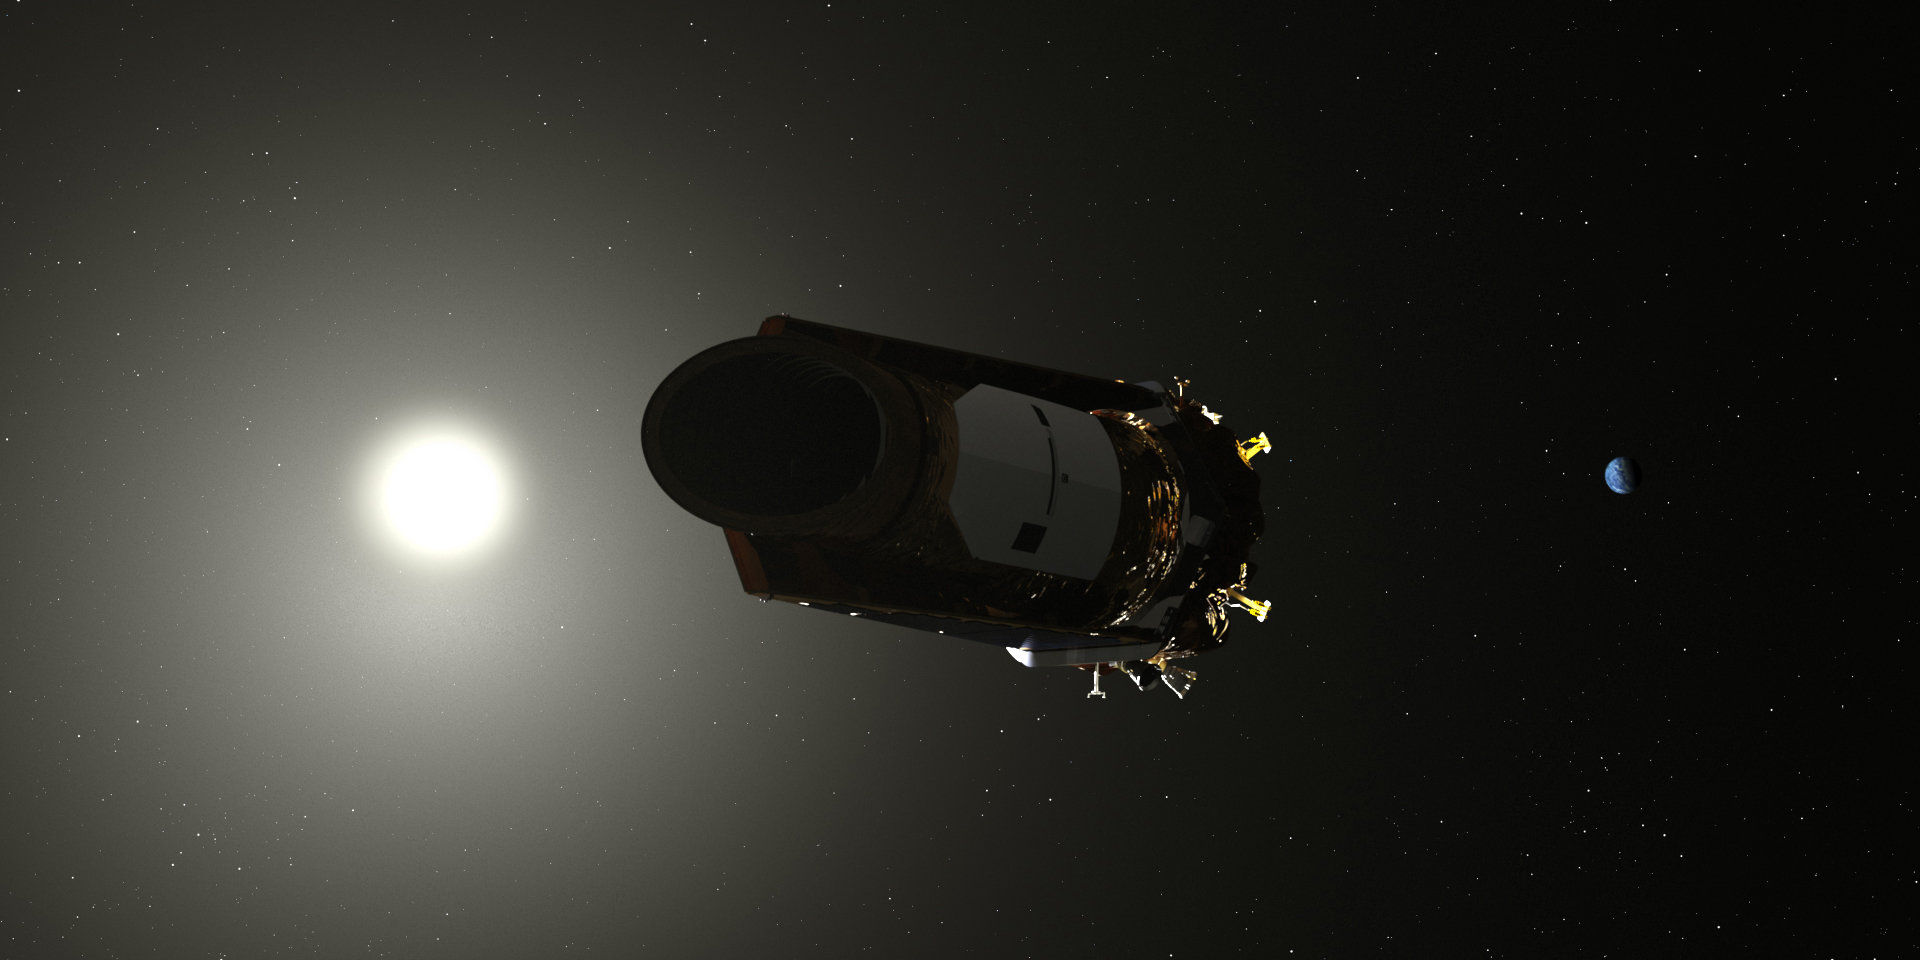
“Kepler” is an orbital telescope with a super-sensitive photometer, which was engaged in searching for exoplanets. At the same time, Kepler could observe approximately 100 thousand stars. The task of the system was to observe a certain group of stars for a long time. In order to achieve the goal, the engineers developed a mechanism that would keep the telescope’s “sight” pointing to a specific point.

Approximately such flywheels were used by Kepler.
Important elements of this mechanism were flywheels, flywheels, which helped position the entire structure. These were the only moving parts. There was also some fluid — the fuel that the engines used to change the position of the telescope in space.
Specifications:
- diameter 2.7 m, length - about 4.7 m;
- weight - 1052.4 kg, of which 478 kg - photometer, spacecraft - 562.7 kg, 11.7 kg - hydrazine fuel;
- solar panels - a total area of 10.2 m2. The battery consists of 2860 cells, which allows you to generate 110 watts of power. Energy was accumulated using a lithium-ion battery with a capacity of 20 Ah;
- Solid state drive - 16 GB, it contained the amount of data collected for 60 days, the information was transmitted to Earth once a month.
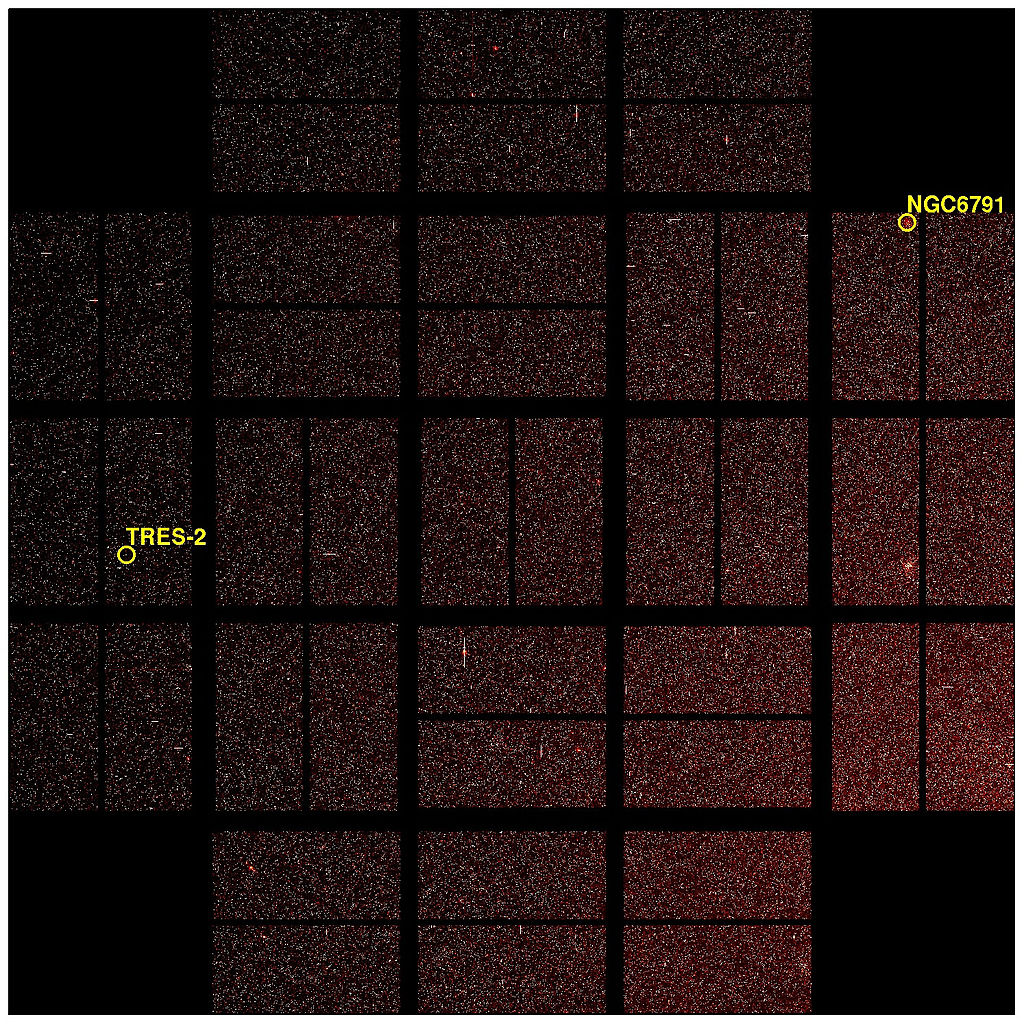
The photometer consists of 42 CCDs providing a total resolution of 95 megapixels. The design provides four additional CCD arrays at the corners of the array - to provide more precise control. The size of each matrix is 5 x 2.5 cm, resolution is 2200 x 1024 pixels.

“Inside” view The
data from the matrices were taken every 6 seconds, upon reaching the saturation limit, after which they were summed up in the on-board computer for half a minute for each pixel. "Kepler" conducted observations in the passband 430-890 nm. He could "see" stars up to the 16th magnitude .
The main mirror with a diameter of 1.4 meters was made by the company Corning - the one that develops protective glasses for smartphone screens. Its technology has led to a radical reduction in the mass of the mirror. As a result, it amounted to only 14% of the mass of the mirror of the same size, made of traditional materials.
For different elements, working temperatures were different. So, Schmidt's corrector, which was a non-spherical lens in front of the telescope, worked at a temperature of about -30 ° C. The main mirror, located behind, worked at -11 ° C. The CCD sensor was under more difficult conditions - it had to work at a temperature of -85 ° C, which is necessary to reduce the detector noise. With the dust cap closed during calibration, the temperature of the components was slightly above this minimum. The temperature in open space is quite sufficient so that there is no need to use liquefied gas to cool the device.
Who managed Kepler and how?
The headquarters of the apparatus was located on the research campus of the University of Colorado Boulderd. The management team consisted of specialists from the Laboratory of Atmospheric and Space Physics under the contract of Ball Aerospace & Technologies. The laboratory made plans of work, collected primary data and distributed them.
The project budget was initially estimated at $ 600 million, including the creation, launch of the device and its operation for 3.5 years. In 2012, NASA announced that the project will be financed up to 2016 with an annual budget of $ 20 million.
Data exchange "Kepler" with the Earth
The data exchange with the telescope went through the microwave connection (frequency spectrum from 7 to 11.2 GHz) twice a week. Scientists transmitted commands and received data from the device. However, scientific data were downloaded once a month, also via the microwave channel, but already with a spectrum of 26.5–40 GHz. The width of the communication channel did not exceed 550 kB / s.

The antenna of the apparatus was rigidly fixed, so that in order to communicate with the Earth, it was necessary to change the position in space of the entire orbital telescope. Part of the data was analyzed by the on-board computer in order to save on traffic by transmitting compressed information.
Telemetry data collected during the mission was forwarded to the Project Data Management Center. The center is located at the Space Research Institute with the help of a space telescope. This is a science-based operations center established by NASA in 1981 to manage and conduct research using the Hubble Space Telescope.
During communication sessions, in order to download scientific data from Kepler, the following operations had to be performed:
- Get the primary pixelated pixel data from the DMC (Kepler Data Management Center, Kepler Data Management Center);
- To process the primary data using specialized analysis algorithms to obtain calibrated pixels and light curves for each star;
- Perform a transit search (changing the star's brilliance when the planet passes through its disk) to detect planets (threshold crossing events or TCEs);
- Check data on candidate planets to eliminate false positive detections.
What were the goals and objectives?
The scientific goal of Kepler was to study stellar systems located within the telescope's “field of vision”. The following tasks were set:
- Determine the number of earth-like planets that are in a potentially habitable zone;
- Calculate the range of sizes and shapes of the orbits of these planets;
- Estimate the number of planets that are in multi-star systems;
- Determine the range of orbit sizes, brightness, diameter, mass and density of short-period giant planets;
- Detect additional objects in each planetary system found;
- Studying the properties of stars in which planetary systems have been discovered.
Software tools
For processing the data that Kepler sent to Earth, they used such software tools:
- Lightkurve - Lightkurve Python effectively analyzes the time series of astronomical data streams, in particular pixels and light cubes, obtained by NASA Kepler, K2 and TESS missions. Link .
- PyKE - A command line toolkit for checking data and extracting star gloss curves. Link .
- K2fov - A set of command line tools for checking target pixel files and highlighting hidden light cubes. Link .
- K2ephem - Checks whether a moving body of the Solar System, an asteroid or a comet, can get into the "field of view" of the system. Link .
- K2flix - Converts target pixel files to video or animated gif files for quick and easy evaluation of such pixels. Link .
- K2mosaic - Converts target pixel files to wide field images. Link .
- Kadenza - Converts raw data to FITS, convenient for astronomers. Link .
Representatives from the developer community have made some tools available to everyone. There is also auxiliary software, which is available on the “ Other Software ” page . And on the NASA site you can find a complete list of software and the purposes for which it serves .
Results of work - short
For several years of operation, the telescope was able to detect 2245 exoplanets and more than 2000 potential exoplanets - these data are checked by scientists.
In fact, the telescope transmitted so much information to Earth that it would take years to analyze and analyze it in detail.
"Kepler" significantly expanded the concept of star systems, their evolution and diversity. In particular, the existence of Earth-like planets was proved - earlier astronomers could only speculate about the characteristics of the planets.
What's next?

The TESS (Transiting Exoplanet Survey Satellite) has come to replace the Kepler telescope. The launch was made on April 18, 2018 by the SpaceX Falcon 9 rocket. TESS studies the brightest stars that are no more than 300 light-years from Earth. The goal is to detect stony exoplanets that fall into the habitable zone. It is planned to survey about 500 thousand stars of spectral classes G, M, R brighter than 12 magnitude. In addition, 1000 nearest red dwarfs, which are scattered throughout the starry sky, will be studied.
